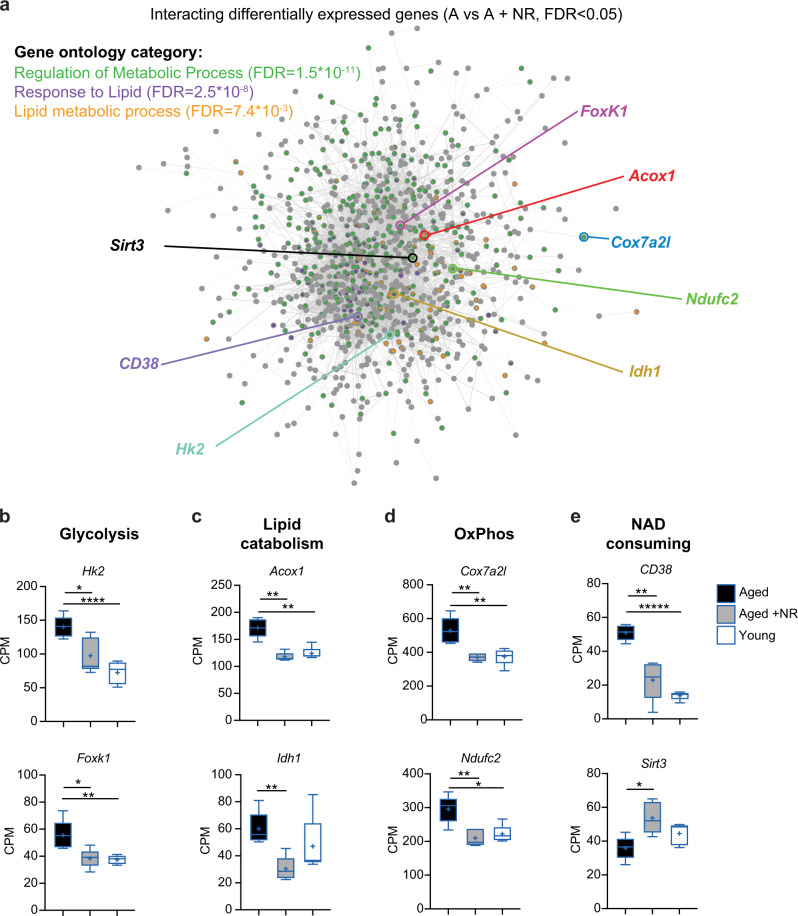
Fig. 3. NR treatment modulates the expression of metabolic genes.
a String-db protein–protein interaction map for differentially expressed genes between aged and NR-treated aged HSC (false discovery rate < 0.05); genes associated with gene ontology categories related to metabolic regulation are indicated by coloured nodes. b–e Expression levels of key genes associated with glycolysis, lipid catabolism, oxidative phosphorylation and NAD consumption in aged HSC (n = 5, biological replicates), NR-treated aged (n = 5, biological replicates) and young HSC (n = 5, biological replicates). Statistical analysis was performed using String-db (a) and EdgeR (false discovery rates between two groups were determined considering the third group as background, b–e). Data are expressed as box-and-whisker plots. Box indicates 25th to 75th percentile, line indicates the median and whiskers indicate min to max values. *FDR < 0.05, **FDR < 0.01, ***FDR < 0.001, ****FDR < 0.0001, *****FDR < 0.00001. Only statistically significant comparisons are indicated. Exact FDR values comparing individual groups associated with b–e are presented in Supplementary Fig. 3d. NR nicotinamide riboside, HSC hematopoietic stem cells, OxPhos oxidative phosphorylation, CPM TMM-corrected counts per million sequencing reads, Y young, A aged, A + NR NR-treated aged animal. Source data are provided as a Source Data File.

