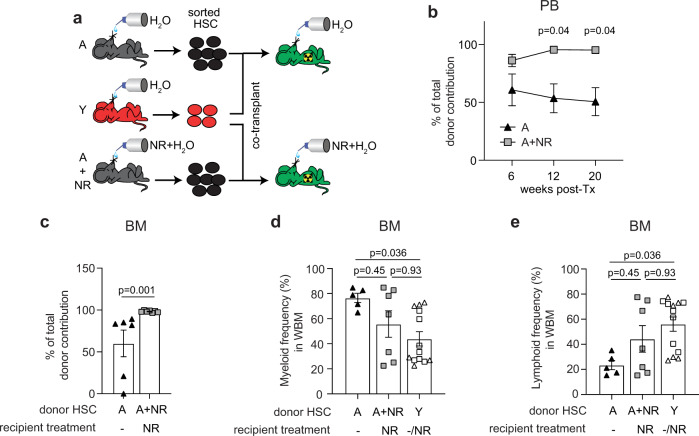
Fig. 7. NR administration significantly improves HSC reconstitution potential of aged HSC.
a Schematic representation of the experimental set up for the competitive transplant experiment. b Quantification of the percentage of aged (n = 6, biological replicates) and NR-treated aged (n = 7, biological replicates) donor cells relative to total donor-derived CD45+ hematopoietic cells in PB of young recipient mice at 6, 12, and 20 weeks and c BM at 20 weeks following transplantation. Data are mean ± s.e.m. and are representative of a single experiment. Statistical analysis was performed using two-way ANOVA with Geisser-Greenhouse correction, p = 0.01 (overall for treatment factor) with individual groups for each timepoint compared using Holm–Sidak multiple comparisons test, p-values indicated for b and two-sided Mann–Whitney U-test for c. d, e Quantification of the frequency of aged (n = 5, biological replicates), NR-treated aged (n = 12, biological replicates. Circle symbols refer to untreated recipients and square symbols refer to NR-treated recipients) d myeloid cells (Gr1/Mac-1+) and e lymphoid cells (B220+, CD3+) in BM of recipient mice 20 weeks after transplantation. For recipients where <0.01% engraftment of the relevant cell population was observed, no lineage analysis was performed. Data are mean ± s.e.m. and statistical analyses were performed using Kruskal–Wallis, p = 0.042 (overall) with individual groups compared using Dunn’s multiple comparisons test, p-values indicated for (d, e). Triangle symbols refer to untreated recipients and square symbols refer to NR-treated recipients. BM bone marrow, WBM total bone marrow, HSC hematopoietic stem cells, NR nicotinamide riboside, PB peripheral blood, Y young, A aged, A + NR NR-treated aged animal. Source data are provided as a Source Data File.

