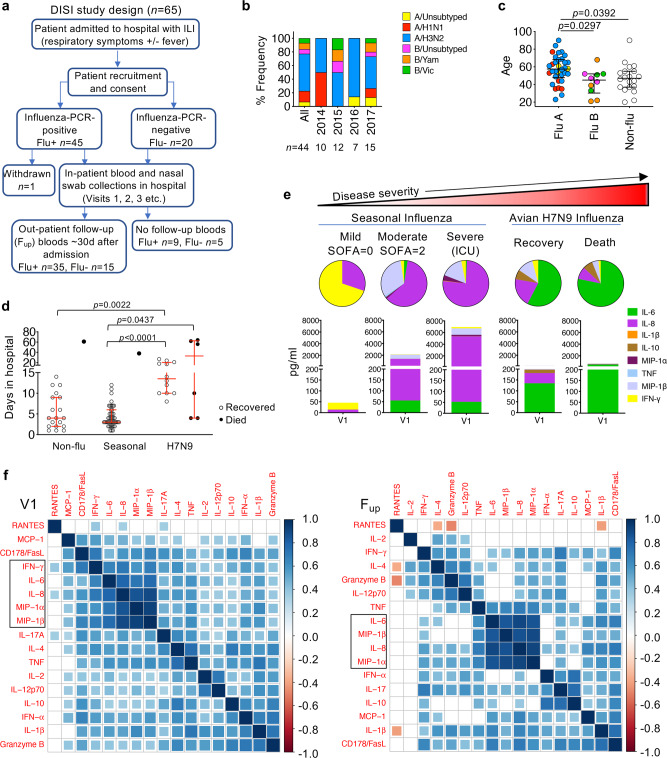
Fig. 1. Cluster analysis of patient clinical information, genetic characteristics and inflammatory cytokines.
a Flow chart of study design. b Frequency of patients infected with seasonal influenza virus strains. N values are below for total and for each year. c Age distribution by influenza A (3 unsubtyped, 7 H1N1, 24 H3N2), influenza B (3 unsubtyped, 4 YAM, 3 VIC) and influenza-negative (Non-flu, Flu-) patients (n = 20). Virus strain colors match those in (b). d Days in hospital for DISI cohort and H7N9 cohort. c, d Bars indicate the median and IQR, statistical significance (0.0001 > p < 0.05) was determined using the Kruskal–Wallis test (two-tailed). e Representative serum levels and distribution of pro-inflammatory cytokines in patients, measured within the first 2–3 days of hospital admission (Visit 1, V1), with varying disease severity. f Partial correlation plots showing the degree of correlation between every chemokine/cytokine pair in influenza+ patients at V1 and Fup. The color corresponds to the correlation coefficient and the size of the colored squares correspond to the FDR-adjusted p value. Correlations that are not significant (p > 0.05) result in white boxes.

