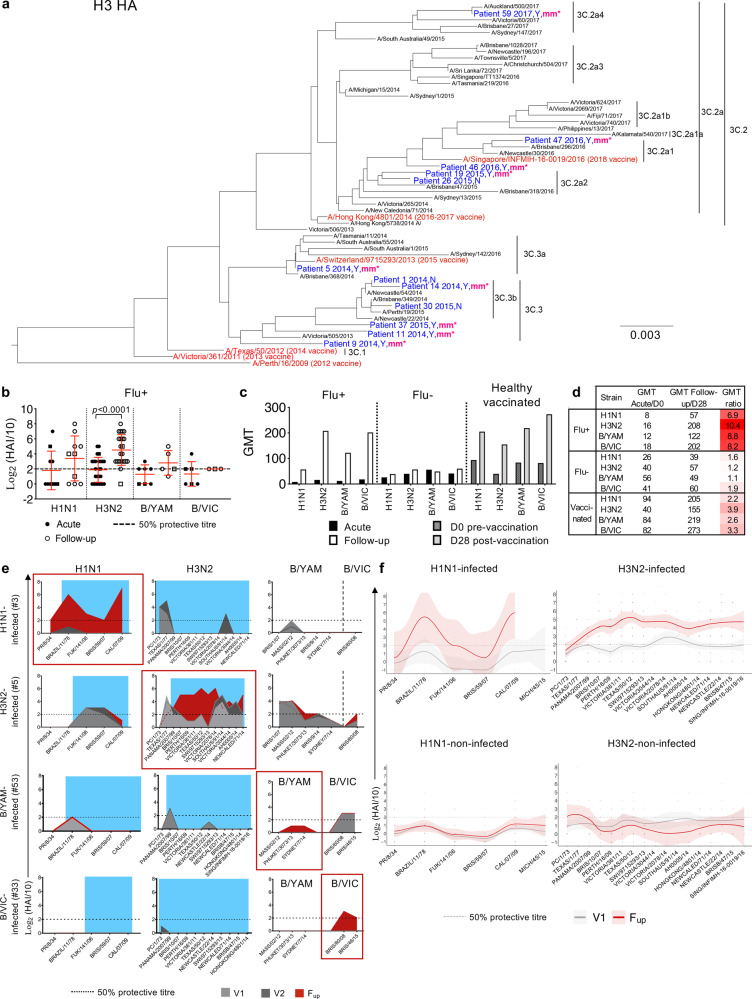
Fig. 2. Viral analysis and antibody responses.
a H3N2 phylogenetic tree of HA amino acid sequences from previous WHO reference strains in black, influenza vaccine strains in red and sequences isolated from the nasal swab of 12 H3N2-infected patients in blue. Patient number is followed by the year of recruitment, yes (Y) or no (N) for prior vaccination in the year of infection, and “mm*” indicates whether the vaccine was a clade mismatch in that year. Scale bar represents the number of substitutions per site. b Antibody HAI titers of influenza+ (Flu+) patients at acute (V1 or V2) and follow-up timepoints from the relevant infected strain (H1N1 n = 10, H3N2 n = 26, B/YAM n = 7, B/VIC n = 6) (mean and SD are shown). Statistical significance (0.0001 > p < 0.05) was determined using a two-sided Mann–Whitney test between acute and follow-up per strain. c, d Geometric mean titers (GMT) per strain in influenza+ and influenza- (Flu-) patients at acute and follow-up, and from a healthy vaccinated cohort at days 0 and 28 post-vaccination. b–d Both H1N1 and H3N2 titers are shown for three A/unsubtyped patients and both B/YAM/Phuket/3073/2013 and B/VIC/Brisbane/60/2008 titres are shown for three B/unsubtyped patients (square symbols). e Representative antibody landscapes from a patient infected with H1N1, H3N2, B/YAM or B/VIC virus. Blue shading indicate period of potential exposure based on the year born. f Antibody landscapes of H1N1- and H3N2-infected (n = 7 and 23, respectively) and H1N1- and H3N2-non-infected patients (n = 45 and 29, respectively). Lines and shading indicate the GMT and 95% confidence intervals, respectively. Gradient colored dots indicate individual titres.

