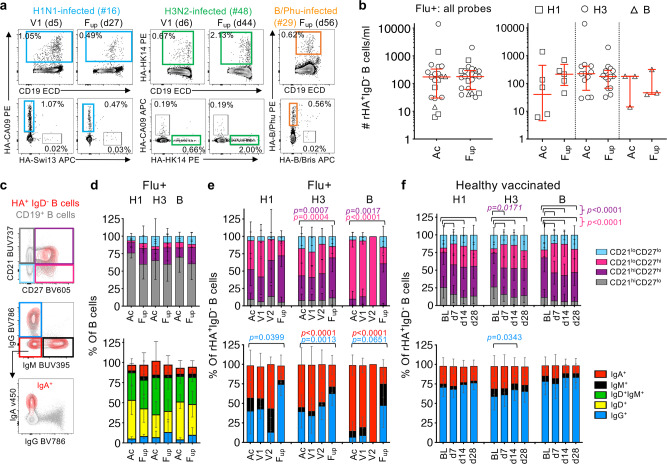
Fig. 4. Contrasting influenza-specific B cell responses between influenza infection and vaccination.
a Representative FACS plots of H1-, H3- and B-specific rHA+ B cells at V1 and Fup timepoints (days after disease onset in brackets). b Numbers of total rHA+ B cells and per H1-, H3- and B-specific rHA+ B cells at acute (Ac) (n = 21) and Fup timepoints (n = 22). Red bars indicate the median and IQR for cell numbers. c Representative overlay FACS plots of live total B cells and rHA+ B cells from IBV-infected patient #29 at Fup for phenotype and isotype characterization. d–f Phenotype (top panel) and isotype (bottom panel) distributions of (d) total B cells and (e) rHA+ B cells in influenza+ (Flu+) patients at acute (Ac = V1 and V2, V1, V2) and follow-up timepoints in comparison to (f) healthy vaccinated controls (n = 41) pre-vaccination at baseline (BL) and d7, 14 and 28 post-vaccination. d–f Bars indicate the mean and SD for frequencies. e, f Statistical significance (0.0001 > p < 0.05) was determined using a two-tailed Tukey’s multiple comparison test. Colored p values refer to each group legend within the graph.

