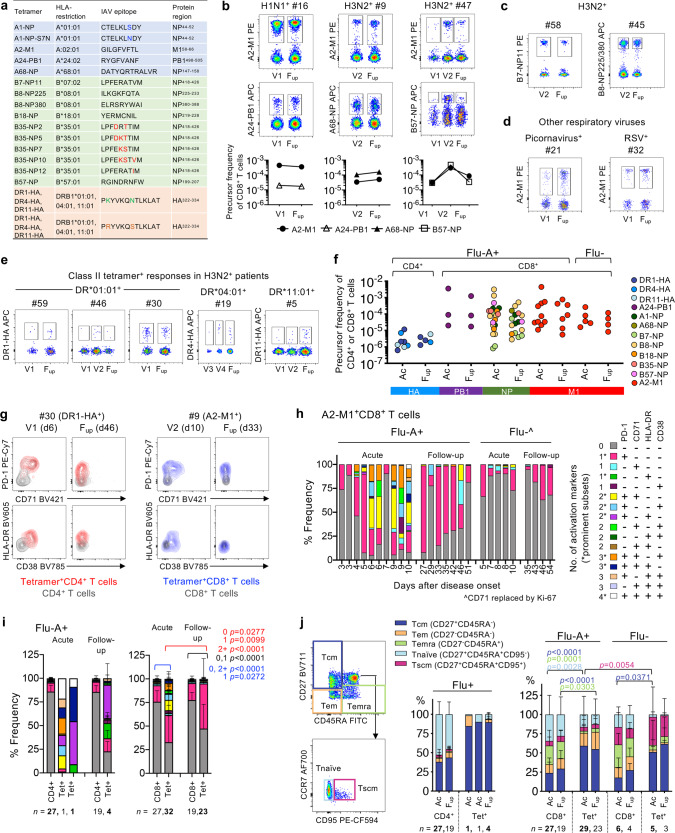
Fig. 6. Influenza-specific CD4+ and CD8+ T cell responses.
a List of influenza-specific HLA class I (A, B) and class II (DR) tetramers used in the study. b, c Concatenated FACS plots of TAME-enriched class I-tetramer+ cells gated on CD8+ T cells from influenza+ patients and (d) influenza- patients. Individual tetramer precursor frequencies are shown below for patients in (b). e Concatenated FACS plots of TAME-enriched class II-tetramer+ cells gated on CD4+ T cells from H3N2-infected patients. f Precursor frequencies of tetramer+ cells from influenza+ (Flu+) and influenza- (Flu-) patients at acute (V1, V2, V3 or V4) and follow-up timepoints. g Representative overlay FACS plots of activation markers expressed on TAME-enriched tetramer+ cells compared to their unenriched parent population. h Frequency of A2-M1+CD8+ T cells from individual influenza A+ (Flu-A+) and influenza- patients expressing different combinations of activation markers PD-1, CD38, HLA-DR and CD71, where CD71 was replaced by Ki-67 in the staining panel for influenza- patients. i Overall activation status of TAME-enriched tetramer+ cells compared to their unenriched parent population of CD4+ or CD8+ T cells in influenza+ patients. j T cell differentiation phenotype of TAME-enriched tetramer+ cells in relation to the unenriched parent population of CD4+ or CD8+ T cells. i, j Mean and SD are shown for all acute and follow-up timepoints, except for the acute tetramer+CD4+ group (n = 2), which were plotted individually. Statistical significance (0.0001>p<0.05) was determined using two-tailed Tukey’s multiple comparison test for (i) number of activation markers present (0, 1 or 2+) and (j) T cell differentiation subsets.

