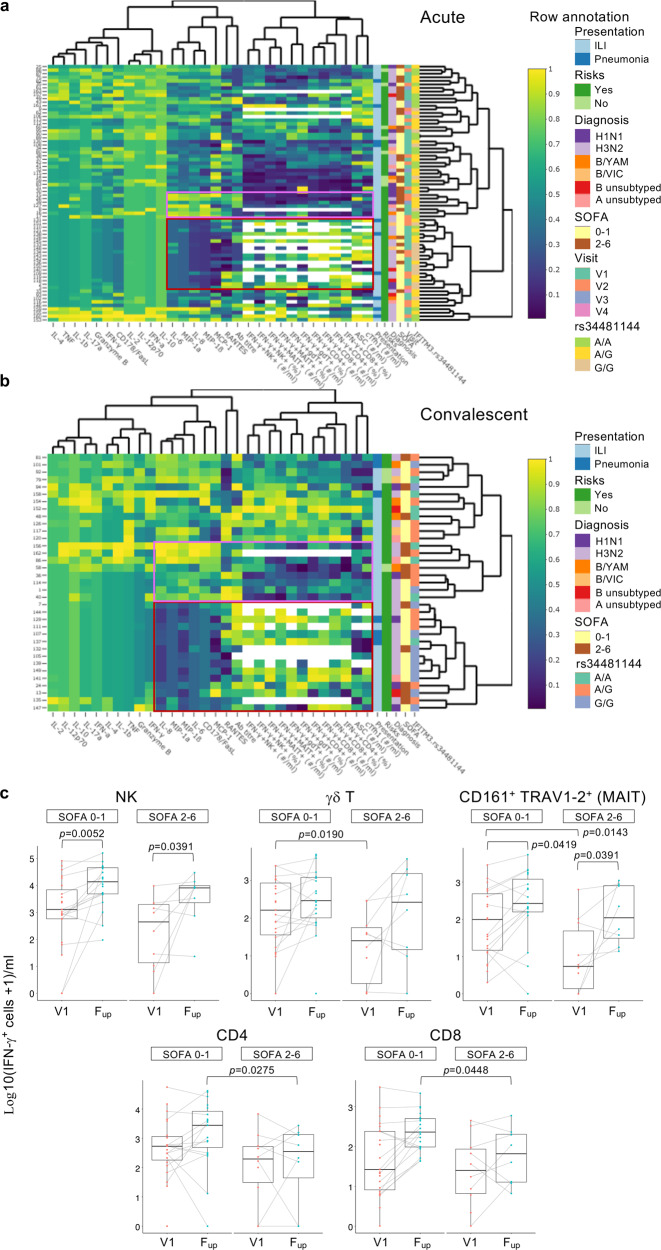
Fig. 7. Analyses of immune responses and clinical and genetic host factors.
a,b Unsupervised heatmaps of immune, clinical and genetic parameters in influenza+ patients at (a), acute and (b), convalescent timepoints. Scale visualizes each variable using the Empirical Percentile Transformation. A value of 1 means that the measure was higher than 100% of the other samples for that measure. Each variable was transformed independently. Interactive heatmaps are shown in Supplementary Data 2–6 for influenza+, influenza- and combined datasets. Regions of low (maroon) and high (pink) cytokine clusters are boxed. c Box plots of IFN-γ-producing cells following influenza virus infection assay (n = 37), at the earliest acute (V1) and convalescent (Fup) timepoints as a function of patients’ disease severity via binned SOFA scores of 0–1 versus 2–6. Box plots represent the median (middle bar), 75% quantile (upper hinge), and 25% quantile (lower hinge), with whiskers extending 1.5 times the inter-quartile range. Nonparametric Wilcoxon rank sum test with continuity correction was used for comparisons between SOFA categories (two-tailed). Wilcoxon signed rank test (a paired test, two-tailed) was used to compare differences between V1 and Fup among the same individuals. Tests were carried out on the actual data, although plots were on a log10+1 scale for ease of visualization. Statistically significant p values are shown (0.0001>p<0.05).

