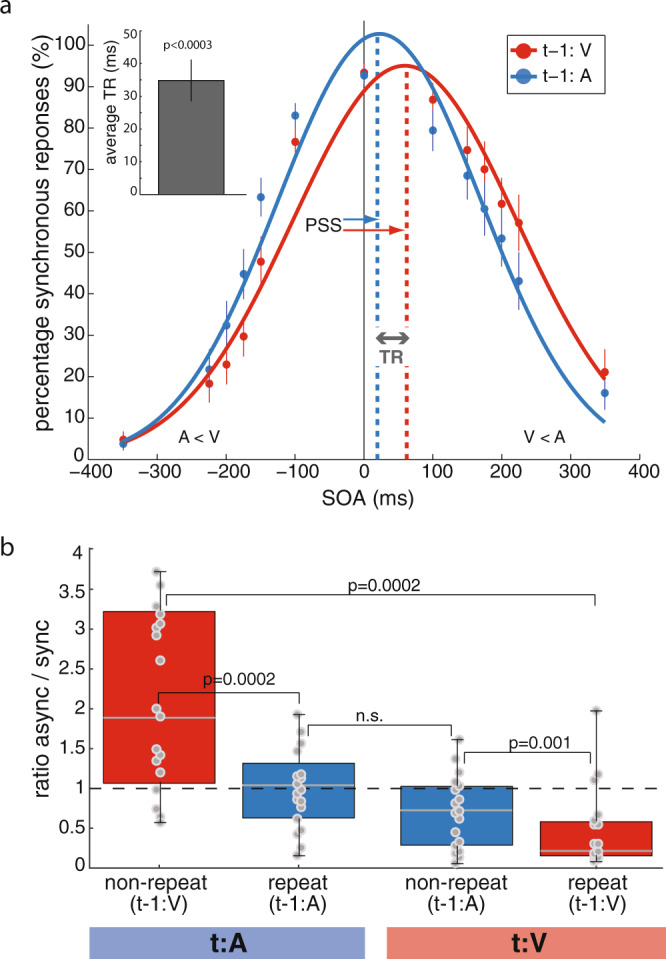
Fig. 2. Behavioral performances.

a Synchronous responses as a function of stimulus onset asynchrony. Psychometric curves (Gaussian model adjusted to behavioral measures) showing the percentages of synchronous responses as a function of SOA for trials with visual lead on the previous trial (t-1:V, red) and those with auditory lead (t-1:A, blue). Dots represent average behavioral reports across participants (n = 18). The colored thin lines indicate the standard errors of the mean (SEM). Inset: mean temporal recalibration (TR) estimate and SEM across participants evaluated against zero with a two-tailed, one-sample t test. b Individual ratios of asynchronous-to-synchronous responses for all trial configurations. Ratios of asynchronous to synchronous responses across participants for all t-1/t trial combinations, i.e. auditory or visual lead on trial t (t:A or t:V) paired with visual or auditory lead on the previous trial (t-1:V and t-1:A). The lower and upper limits of the red and blue boxes represent the interquartile range (quartiles Q1 and Q3); gray center lines denote Q2 (median); whiskers represent minimal and maximal data points; gray dots represent single-subject data (n = 18). The dashed black horizontal line highlights a ratio of 1. Wilcoxon signed-rank tests were performed between all trial combinations; n.s.: p > 0.0125 after accounting for multiple comparisons.
