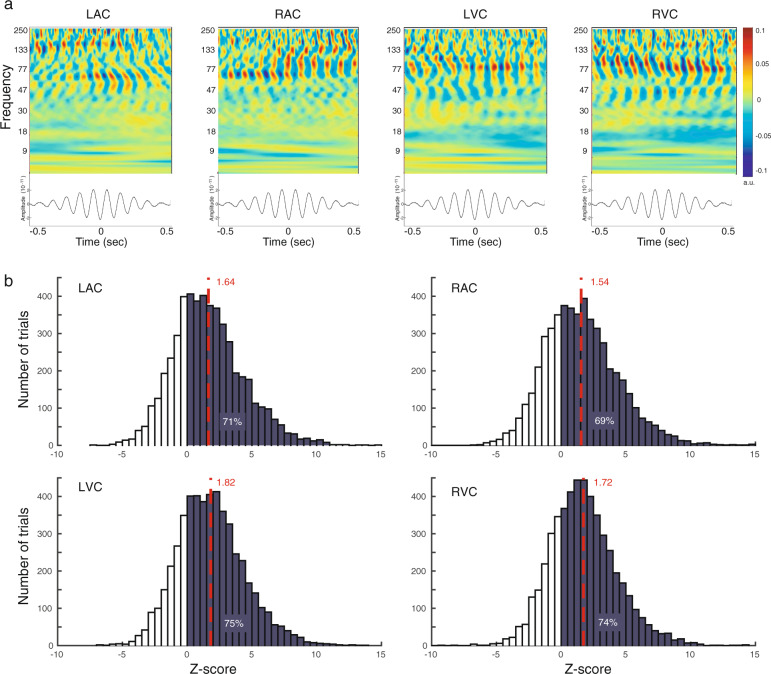
Fig. 4. Inter-trial, pre-stimulus PAC in auditory and visual cortex.
a Empirical evidence of PAC manifestations in neurophysiological cortical traces. Time-frequency decompositions (top) of neurophysiological traces and their event-related average (bottom) time-locked to the troughs of slow-frequency fP (10 Hz) cycles, for each ROI in a representative participant. LAC, RAC: Left/right auditory cortex; LVC/RVC: Right auditory cortex. b Statistical significance of measured PAC effects. Group average (n = 16) histograms of z-transformed PAC measures of task data across trials, relative to surrogates. Dark-shaded areas emphasize positive task PAC z-scores (where PAC was stronger than in surrogates) with their prevalence across trials in each region indicated as percentages. The dashed red lines indicate the mean task PAC z-score in each region, averaged across trials and participants.

