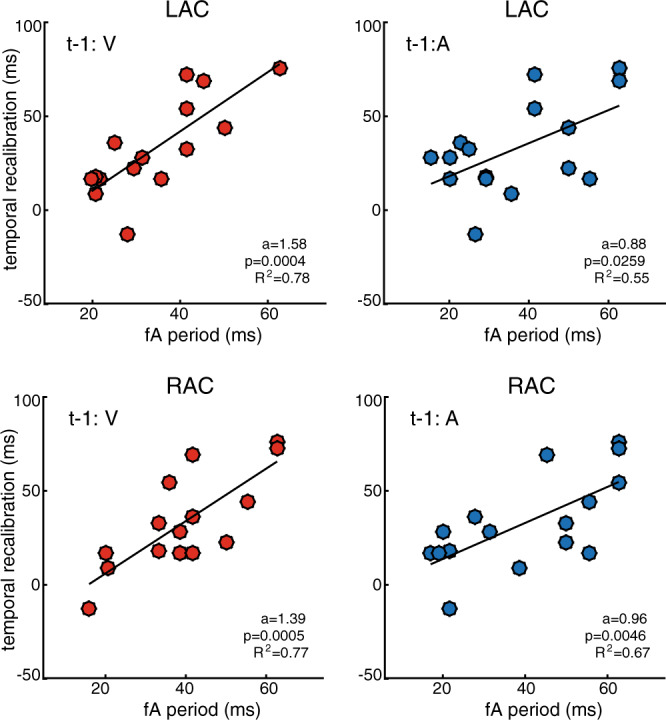
Fig. 5. Temporal recalibration is quantitatively related to fA period.

Individual temporal recalibration estimates (n = 16) are plotted against the observed fA period durations measured over the pre-stimulus period in the auditory cortex for trials with visual (red) and auditory (blue) lead on the previous trial. The dots represent single-subject values. In each panel, the regression line of best fit is depicted in black. The regression coefficients a, p-values, and effect size r2 are indicated in the respective panels.
