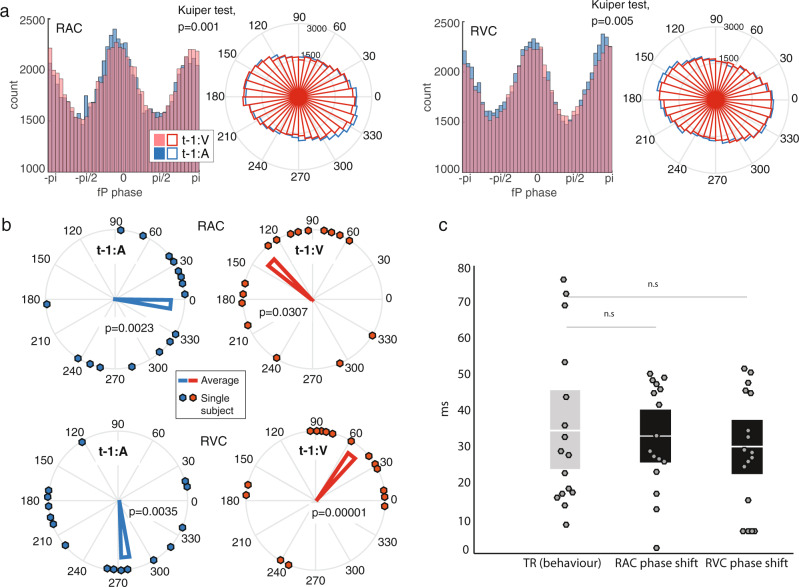
Fig. 6. Modality order on the previous trial modulates preferred coupling phase.
a Histogram and rose plots show the empirical distribution of single-trial preferred phase angles of PAC along the fP cycle, for trials with visual lead on the previous trial (t-1:V; red) and those with auditory lead (t-1:A; blue) extracted from all MEG sources within RAC and RVC and pooled across participants (n = 16). The Kuiper test assessed whether the two circular distributions were significantly different. b Rose plots show the distribution of individual preferred phase angles (dots) and the group circular average of PAC preferred phase φ of fA oscillations along the fP cycle. Data from trials with visual lead on the previous trial (t-1:V condition) are shown in red and those with auditory lead (t-1:A condition) are shown in blue, in RAC (top) and RVC (bottom). Rayleigh tests assessed uniformity of phase angle distributions across subjects around the unit circle (p-values are displayed). c The PAC phase shifts measured between conditions in the auditory (left black bar; RAC) and visual (right black bar; RVC) cortex, once converted to milliseconds from phase angles along the fP cycles (Equation 1), were statistically identical on average to the empirical values of temporal recalibration (gray bar; TR), (both with p > 0.5; two-sampled paired t tests). Dots represent single-subject data (n = 16).

