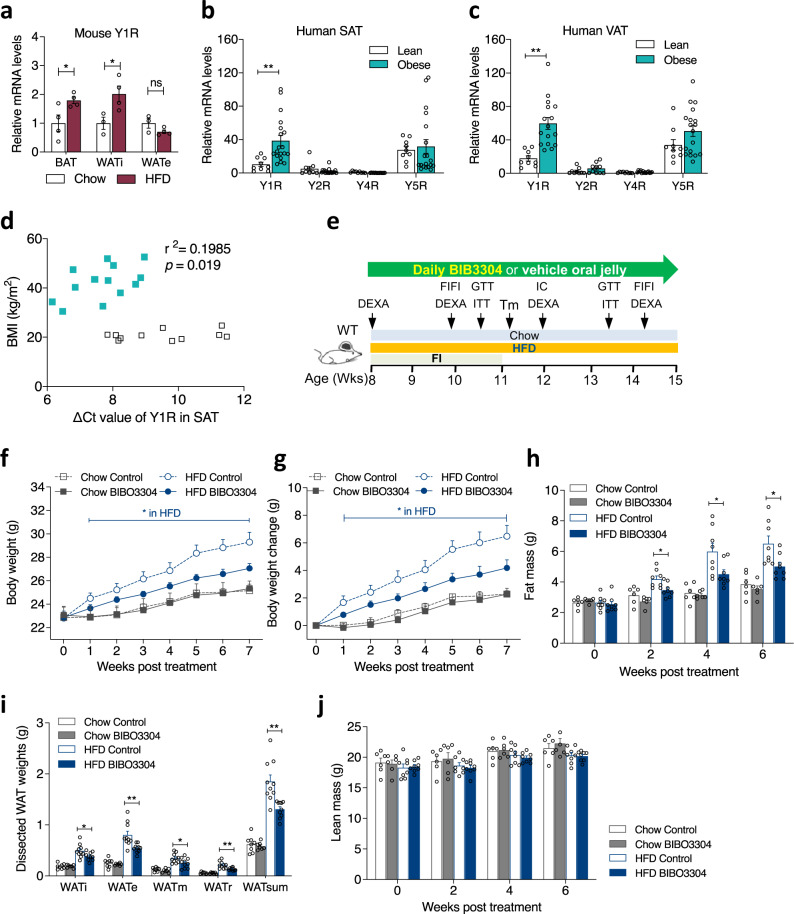
Fig. 1. Y1R mRNA expression in mice and human adipose tissue as well as effect of peripheral Y1R antagonism on body weight and body composition in wild-type mice.
a Y1R mRNA expression in brown adipose tissue (BAT, n = 4 per group), inguinal white adipose tissue (WATi, chow n = 3, HFD n = 4) and epidydimal WAT (WATe, chow n = 3, HFD n = 4) in wild-type mice fed with a standard chow (white bar) or 7-week high fat diet (HFD, magenta bar). Data are mean ± s.e.m. *p < 0.05 by two-tailed t test compared to the same adipose depot of chow-fed mice. ns non-significance. b, c Y-receptor mRNA expression profiles in subcutaneous white adipose tissue (SAT) and visceral white adipose tissue (VAT) from lean (n = 9, white bars) and obese (n = 19, cyan bars) non-diabetic human subjects relative to Y4R expression of lean subjects. Data are mean ± s.e.m. **p < 0.01 by two-tailed t test compared to lean subjects. d Correlation between body mass index (BMI, kg/m2) and ∆Ct values of Y1R mRNA expression in SAT of obese (cyan filled square, n = 16) and lean (open square, n = 11) individuals. Data are mean ± s.e.m. p values by two-tailed Pearson Correlation analysis. e Schematic illustration of phenotypic paradigm. WT wild type, DEXA Dual-energy X-ray absorptiometry, FI food intake, FIFI fasting-induced food intake, Tm temperature measurement by thermal camera, IC indirect calorimetry by Promethion (Sable Systems), GTT glucose tolerance test, ITT insulin tolerance test. f, g Absolute body weight and the change of body weight of wild-type mice on a chow or a HFD treated daily with a jelly containing either vehicle or Y1R-specific antagonist BIBO3304 for 7 weeks. Data are mean ± s.e.m. Chow n = 6 (grey, control: open circle; BIBO3304: filled circle), HFD control n = 10 (blue, open square), BIBO3304 n = 11 (filled square). *p < 0.05, two-way repeated measures ANOVA. h Whole-body fat mass of wild-type mice determined by DEXA at baseline, 2, 4 and 6 weeks after daily administration with control jelly or BIBO3304 jelly. Data are mean ± s.e.m. Chow n = 6 (control: open grey bar; BIBO3304: grey bar), HFD n = 8 (control: open blue bar; BIBO3304: blue bar). *p < 0.05: one-way ANOVA with Tukey’s multiple comparisons test. i Dissected weights of individual WAT from inguinal (WATi), epididymal (WATe), mesenteric (WATm), retroperitoneal (WATr) and total weights of these 4 depots (WATsum) at cull. Data are mean ± s.e.m. Chow n = 7–8 (grey), HFD n = 10 (blue). *p < 0.05, **p < 0.01: one-way ANOVA with Tukey’s multiple comparisons test. j Whole-body lean mass determined by DEXA. Data are mean ± s.e.m, Chow n = 6 (control: open grey bar; BIBO3304: grey bar), HFD n = 8 (control: open blue bar; BIBO3304: blue bar), p values by one-way ANOVA with Tukey’s multiple comparisons test. Source data are provided as a Source Data file.

