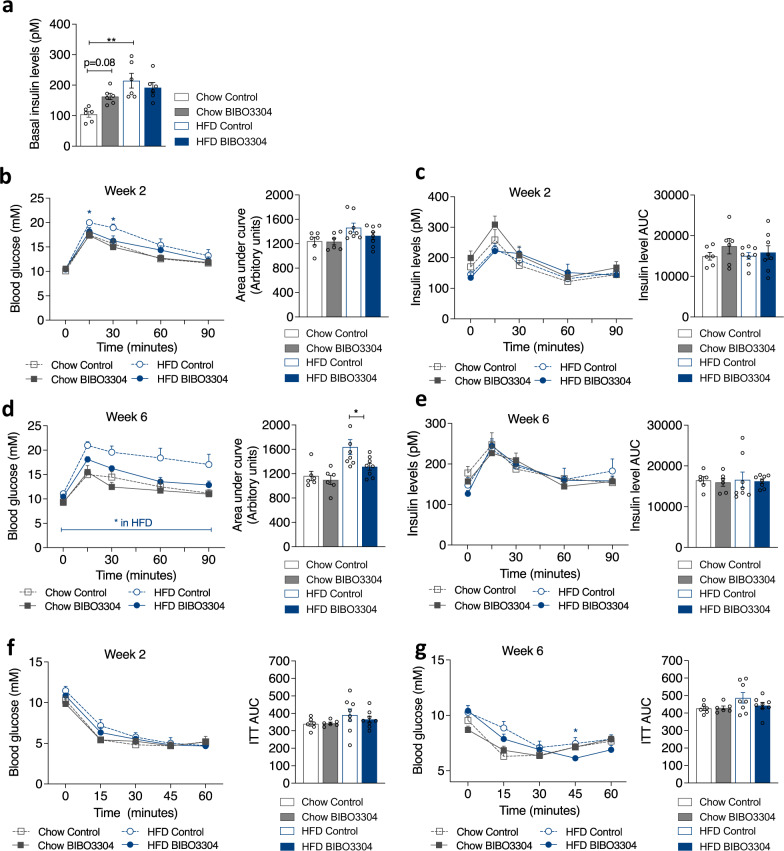
Fig. 3. Effect of peripheral Y1R antagonism on glucose homeostasis.
a Blood insulin levels under fed condition in chow- or HFD-fed wild-type mice given either a chow or a HFD at 13–14 weeks of age. Data are mean ± s.e.m, n = 6 per group (chow, control: open grey bar; BIBO3304: grey bar. HFD, control: open blue bar; BIBO3304: filled blue bar). *p < 0.05, **p < 0.01, one-way ANOVA with Tukey’s multiple comparisons test. Glucose levels in intraperitoneal glucose tolerance tests (GTT) in chow- or HFD-fed wild type mice after 2 (b) and 6 weeks (d) daily treatment with vehicle or BIBO3304, and corresponding area under the curve (AUC) analysis of glucose over time in these mice. c, e, Insulin levels throughout the GTTs 2 and 6 weeks post treatments in (b, d) and corresponding AUC analysis for these mice. f, g, Glucose levels in an insulin tolerance test (ITT) conducted after 2 and 6 weeks daily treatment with either vehicle or BIBO3304, and corresponding AUC analysis for the mice in (f, g). Data are mean ± s.e.m, chow n = 6 (control: open grey; BIBO3304: grey), HFD n = 8 (control: open blue; BIBO3304: blue), *p < 0.05, two-way repeated measures ANOVA with Sidak’s multiple comparisons test. Source data are provided as a Source Data file.

