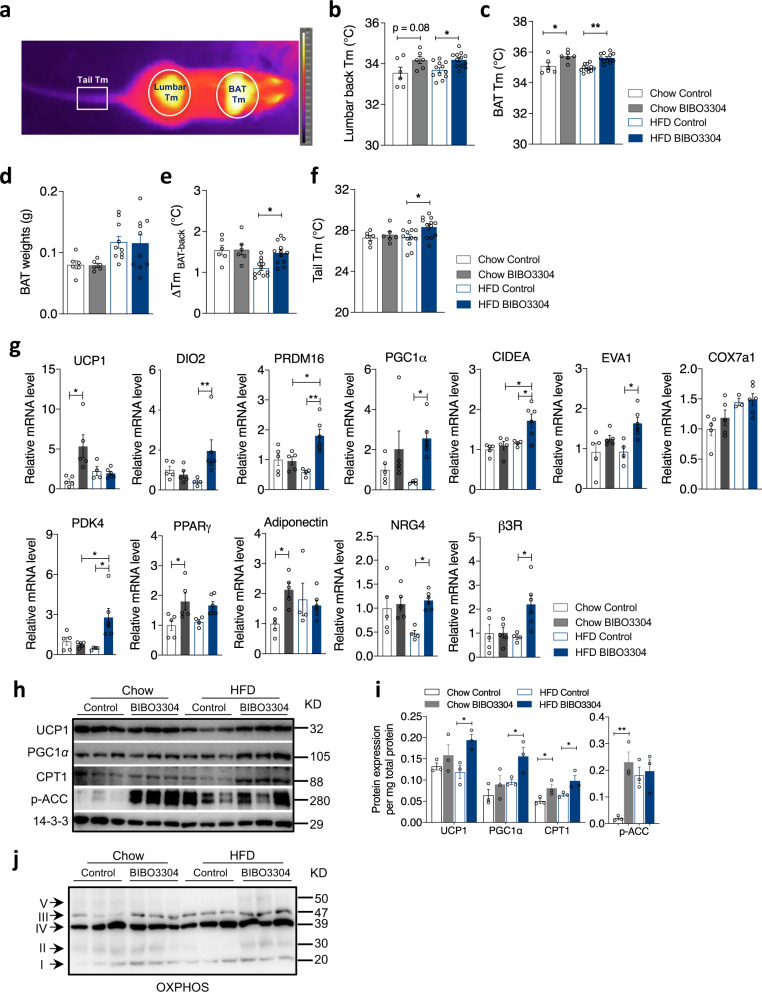
Fig. 4. Peripheral Y1R antagonism increases thermogenesis and promotes the activity of brown adipose tissue.
a Representative infra-red thermal image of the brown adipose tissue (BAT), lumbar back and tail regions of a mouse in this study. Tm Temperature. b Temperature measured by a highly sensitive infra-red camera of lumbar back regions of chow- and HFD-fed mice given vehicle or BIBO3304 jelly at 11 weeks of age. c Intrascapular BAT temperature measured by infra-red camera from the same set of mice. Data (b, c) are mean ± s.e.m, chow n = 6 (control: open grey; BIBO3304: grey), HFD n = 12 (control: open blue; BIBO3304: blue), *p < 0.05, **p < 0.01, one-way ANOVA with Tukey’s multiple comparisons test. d Dissected BAT weights of vehicle- and BIBO3304-treated mice on a chow or a HFD for 7 weeks at cull. Data are mean ± s.e.m, chow n = 6, HFD n = 10, p value by one-way ANOVA with Tukey’s multiple comparisons test. e The temperature differences between the interscapular and lumbar regions in mice administrated with a jelly containing either vehicle or BIBO3304. f Tail temperature measured by a thermal camera in the same cohorts of mice. Data (e, f) are mean ± s.e.m, chow n = 6, HFD n = 12, *p < 0.05, **p < 0.01, one-way ANOVA with Tukey’s multiple comparisons test. g mRNA levels of thermogenic and lipogenic markers in intrascapular BAT of chow- and HFD-fed wild-type mice on a daily administration with either control or BIBO3304 jelly. Data are mean ± s.e.m, chow n = 5 (control: open grey; BIBO3304:grey). HFD control n = 4 (open blue), HFD BIBO3304 n = 6 (blue). *p < 0.05, **p < 0.01, two-way ANOVA with Sidak’s multiple comparisons test. h Western blot images of UCP1, PGC1α, CPT1 and p-ACC protein levels in BAT of vehicle- or BIBO3304-treated mice. p phosphorylated. 14-3-3 was used as a loading control. Images are representative of 3 independent experiments. KD kilodalton. i Quantification of the protein levels normalized to total protein content in BAT or WATi. Data are mean ± s.e.m, n = 3 per group (chow, control: open grey; BIBO3304: grey. HFD, control: open blue; BIBO3304: blue), *p < 0.05, **p < 0.01, one-way ANOVA with Tukey’s multiple comparisons test. j Representative western blotting image of protein levels of 5 OXPHOS complexes in mitochondrial respiration in mice on a chow or a HFD treated with vehicle or BIBO3304. n = 3 per group. Source data are provided as a Source Data file.

