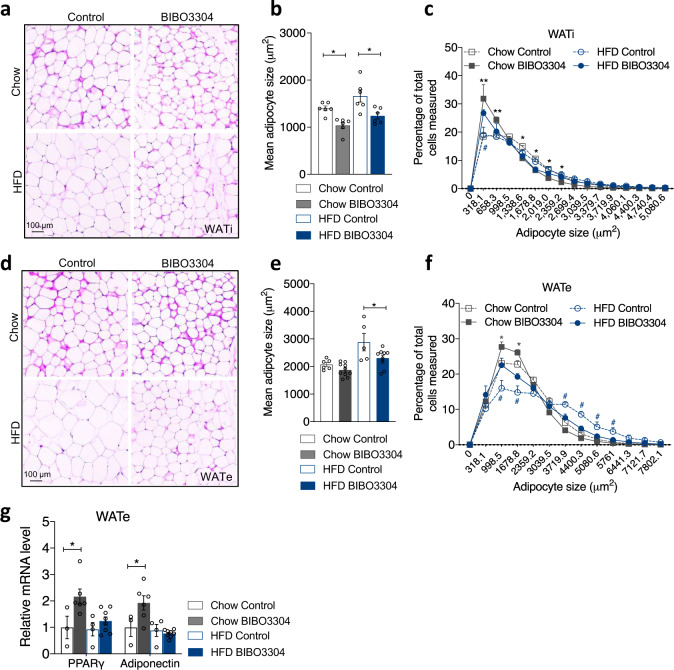
Fig. 6. Effects of peripheral Y1R antagonism on adipocyte size and distribution.
a d H&E staining of WATi and WATe of vehicle- and BIBO3304-treated wild-type mice on either a chow or a HFD. Images are representative of three independent experiments. b, e Average adipocyte size of WATi and WATe in BIBO3304-treated mice relative to that in vehicle-treated mice. Data are mean ± s.e.m, n = 4 per group (chow, control: open grey; BIBO3304: grey. HFD control: open blue; BIBO3304: blue). *p < 0.05, one-way ANOVA with Tukey’s multiple comparisons test. c, f The frequency distribution of adipocyte size in WATi and WATe from vehicle- and BIBO3304-treated mice on a chow or a HFD. Data are mean ± s.e.m, n = 6 per group (chow, grey; HFD, blue. control: open square; BIBO3304: filled square). *p < 0.05, **p < 0.01 BIBO3304 vs control in chow; #p < 0.05 BIBO3304 vs control in HFD, two-way repeated measures ANOVA. g The mRNA levels of adipogenic markers in epididymal WAT (WATe) of chow- or HFD-fed wild-type mice treated with vehicle or BIBO3304 jellies. Data are mean ± s.e.m, chow: control n = 3 (open grey), BIBO3304 n = 6 (grey); HFD: control n = 4 (open blue), BIBO3304 n = 8 (blue). *p < 0.05, two-way ANOVA with Sidak’s multiple comparisons test. Source data are provided as a Source Data file.

