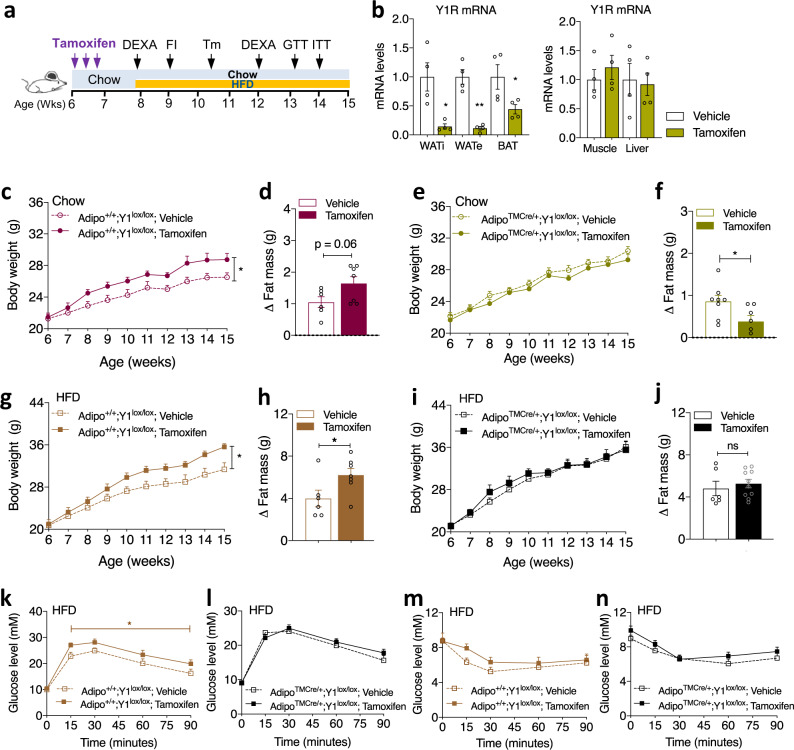
Fig. 8. Y1R signalling in adipose tissue is critical in obesity development.
a Schematic illustration of the paradigm for phenotyping the tamoxifen-induced adipocyte-specific Y1R deletion mouse model. b Relative Y1R mRNA expression in inguinal WATi, epididymal WATe, BAT, skeletal muscle and the liver of AdipoTMCre/+;Y1lox/lox mice receiving either vehicle or tamoxifen determined by RT-PCR using RPL19 as a housekeeping gene. Data are mean ± s.e.m. n = 4 per group (vehicle: white; tamoxifen: mustard). *p < 0.05 vs vehicle in the same fat depot by two-tailed t test. c, g Body weight of vehicle- or tamoxifen-treated Adipo+/+;Y1lox/lox control mice on a standard chow diet or a HFD for 8 weeks. Data are mean ± s.e.m. Chow (c): vehicle n = 7 (open circle), tamoxifen n = 6 (filled circle); HFD (g): vehicle n = 6 (open square), tamoxifen n = 7 (filled square). *p < 0.05, two-way repeated measures ANOVA. d, h, Change of fat mass of vehicle- or tamoxifen-treated Adipo+/+;Y1lox/lox mice on a chow diet or HFD determined by DEXA at 12 weeks of age. Data are mean ± s.e.m. vehicle n = 6 (open bar), tamoxifen n = 7 (filled bar) in both chow (d) and HFD (h); *p < 0.05 by two-tailed t test. e, i Body weight of vehicle- or tamoxifen-treated AdipoTMCre/+;Y1lox/lox on a chow diet or HFD for 8 weeks. Data are mean ± s.e.m. Chow (e): vehicle n = 8 (open circle), tamoxifen n = 10 (filled circle); HFD (i): n = 7 per group (vehicle: open square; tamoxifen: filled square), p values by two-way repeated measures ANOVA. f, j Change of fat mass of vehicle- or tamoxifen-treated AdipoTMCre/+;Y1lox/lox mice on a chow or HFD determined by DEXA at 12 weeks of age. Data are mean ± s.e.m. Chow (f): vehicle n = 7 (open bar), tamoxifen n = 6 (filled bar); HFD (j): vehicle n = 6 (open bar), tamoxifen n = 10 (filled bar). *p < 0.05, two-tailed t test. k, l Glucose levels in an intraperitoneal glucose tolerance test (GTT) in Adipo+/+;Y1lox/lox mice (light brown, vehicle n = 7, open square; tamoxifen n = 8 filled square) or AdipoTMCre/+;Y1lox/lox mice (black, vehicle n = 7, open square; tamoxifen n = 12 filled square) on a HFD at 13 weeks of age. Data are mean ± s.e.m. *p < 0.05, two-way ANOVA. m, n Glucose levels in an insulin tolerance test (ITT) in Adipo+/+;Y1lox/lox (light brown, vehicle n = 7, tamoxifen n = 8) or AdipoTMCre/+;Y1lox/lox mice (black, vehicle n = 7, tamoxifen n = 11) on a HFD at 14 weeks of age. Data are mean ± s.e.m. p values by two-way ANOVA. ns non-significance. Source data are provided as a Source Data file.

