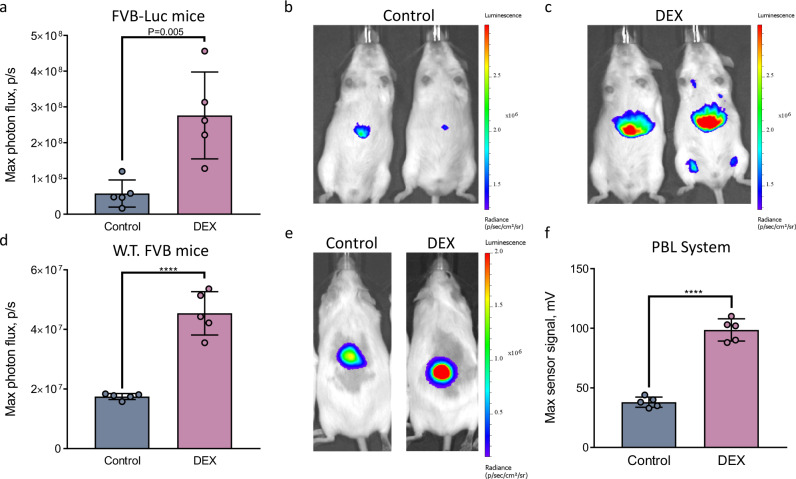
Fig. 4. Noninvasive in vivo measurements of intracellular enzymatic activity of CYP450: direct comparison of stationary CCD camera (IVIS® Spectrum) and PBL readouts.
a Maximal photon flux resulting from two groups of FVB-luc+/+ mice (n = 5) injected with the Luciferin-IPATM probe, a caged luciferin reagent specifically designed to measure activation of the Cyp3a isozyme of CYP45045. The “DEX” group of mice was treated with dexamethasone, a known activator of Cyp3a, 24 h prior to the injection with the Luciferin-IPATM probe, while the control group received a gavage of vehicle only (vegetable oil). The light output was measured with the IVIS® Spectrum. b–c Representative images of two mice from the control (b) and DEX-treated (c) groups. d Maximal photon flux obtained from two groups of wild-type non-transgenic FVB mice (n = 5) injected i.p. with the Luciferin-IPATM probe followed by injection of the luciferase plug (s.c. in the dorsal area) and subsequent imaging by the IVIS® Spectrum. Analogous to the experiment described in (a), the “DEX” group of mice was treated with DEX 24 h prior to the injection with the Luciferin-IPATM probe while the control group received the gavage of vehicle only. The light output of the plug was measured with the IVIS® Spectrum. e Representative mouse images from the control and DEX-treated groups in the experiment described in (d). f Maximum signal output from the experiment described in (d) except that the measurements were performed using the portable light detector. Data are presented as the mean ± s. d. (n = 5). Each “n” represents a biologically independent sample. Statistical significance (****P < 0.0001) was calculated using a two-tailed unpaired t-test. Source data is available as a Source Data file for (a, d and f).

