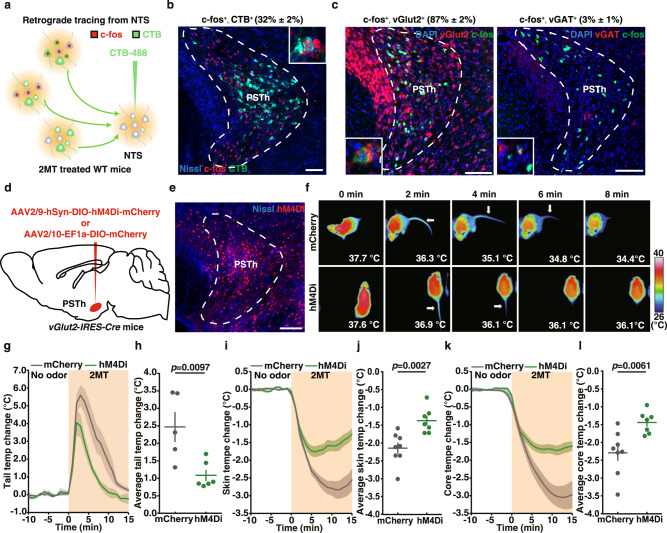
Fig. 2. Inhibition of vGlut2+ PSTh neurons attenuates 2MT-evoked hypothermia and tail temperature increase.
a Schematic of retrograde tracing from NTS neurons by CTB injection. b Representative image showing double immunostaining of CTB and c-fos. The percentage of double-positive neurons (CTB+, c-fos+/CTB+%) in PSTh is in parenthesis (n = 3). c Representative images and quantitative analysis showing the percentage of c-fos+, vGlut2+ or c-fos+, vGAT+ double-positive neurons among c-fos+ neurons in PSTh by two-color in situ hybridization (n = 3). d Schematic of chemogenetic inhibition experiment of vGlut2+ PSTh neurons in vGlut2-IRES-Cre mice. e Representative image of hMD4i-labeled vGlut2+ PSTh neurons (n = 7). f Time-lapsed thermal images of mCherry-expressing mice and hM4Di-expressing mice during 2MT treatment following administration of C21. Tail (g), skin (i), and core (k) temperature curves of mice with (hM4Di, n = 7) or without (mCherry, n = 8) inactivation of vGlut2+ PSTh neurons before and during 2MT treatment. Average tail (h), skin (j), and core (l) temperature changes of mice with (hM4Di, n = 7) or without (mCherry, n = 8) inactivation of vGlut2+ PSTh neurons during 2MT treatment. A few mice were not included in the analysis of tail temperature (e) because their tails were frequently obscured in the thermal images. g–l Data are mean ± SEM; two-side Student’s t test. Scale bars, 100 µm.

