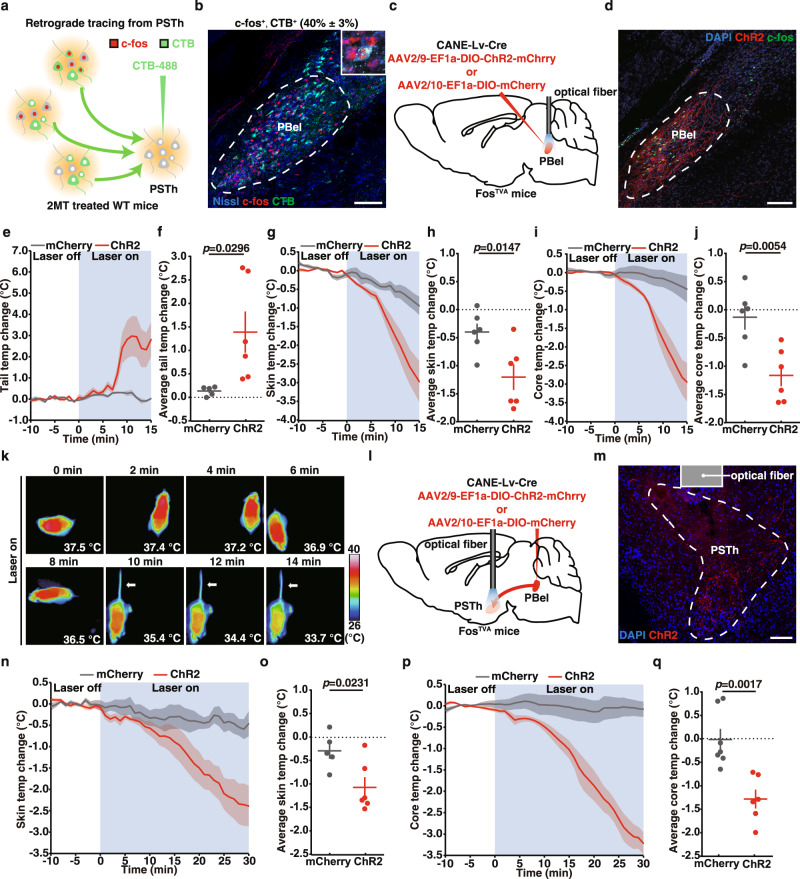
Fig. 6. Activation of 2MT-activated PBel neurons and their axonal inputs to PSTh evokes hypothermia.
a Schematic of retrograde tracing from PSTh neurons by CTB. b Representative images showing double immunostaining of CTB and c-fos. The percentage of c-fos+, CTB+ neurons among CTB+ neurons in PBel is shown in parenthesis (n = 5). c Schematic of selective opto-stimulation of the cell bodies of 2MT-activated PBel neurons labeled by CANE in FosTVA mice. d Representative images showing c-fos expression in the ChR2-labeled PBel neurons following photoactivation (n = 2). Tail (e), skin (g), and core (i) temperature curves of mCherry-expressing (n = 5 or 7) and ChR2-expressing (n = 6) FosTVA mice before and during blue light stimulation of 2MT-activated PBel neurons. Average tail (f), skin (h), and core (j) temperature changes of mCherry-expressing (n = 5 or 7) and ChR2-expressing (n = 6) FosTVA mice during opto-stimulation of 2MT-activated PBel neurons. k Time-lapsed thermal images of ChR2-expressing FosTVA mice during photoactivation of 2MT-activated PBel neurons. l Schematic of selective opto-stimulation of the axon terminals of 2MT-activated PBel neurons in PSTh in FosTVA mice. m Representative images showing the ChR2-labeled axon terminals from 2MT-activated PBel neurons in PSTh (n = 2). Skin (n) and core (p) temperature curves of mCherry-expressing (n = 5 or 7) and ChR2-expressing (n = 6) FosTVA mice before and during blue light stimulation of axon terminals in PSTh. Average skin (o) and core (q) temperature changes of mCherry-expressing (n = 5 or 7) and ChR2-expressing (n = 6) FosTVA mice during blue light stimulation of axon terminals in PSTh. e–j, n–q Data are mean ± SEM; two-side Student’s t test. Scale bars, 100 µm.

