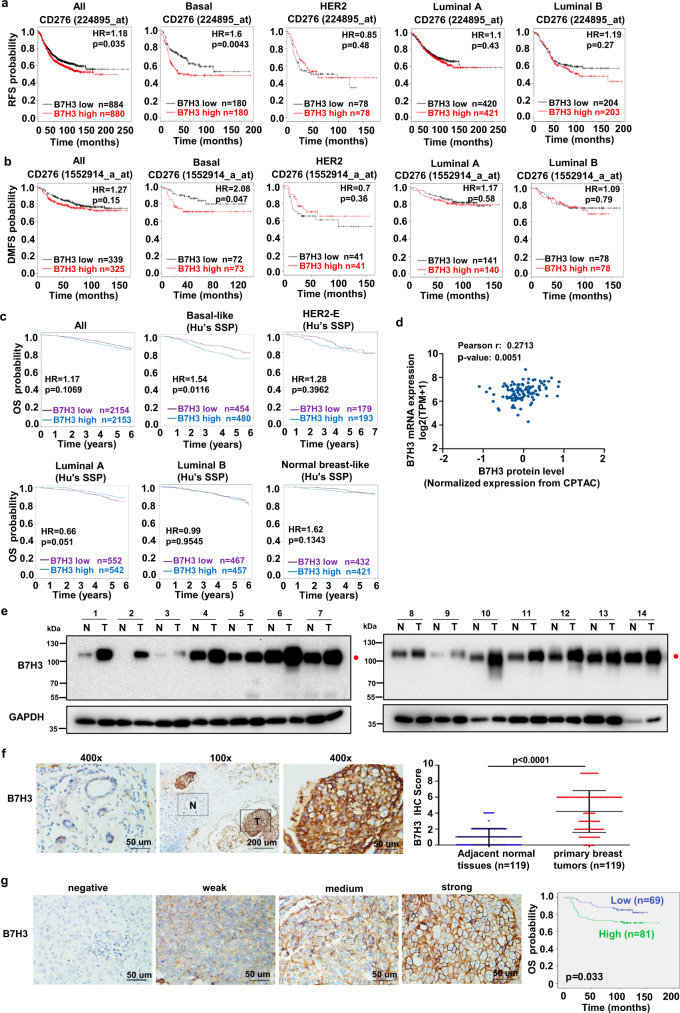
Fig. 1. Upregulation of glycosylated B7H3 and its prognostic significance in patients with TNBC.
a, b Kaplan–Meier analyses (two-sided) of RFS (a) and DMFS (b) based on B7H3 mRNA levels, using the KM-plotter breast cancer database (http://kmplot.com/analysis/). All patients were stratified according to intrinsic breast cancer molecular subtypes. Median cutoff was chosen in the analysis. c Kaplan–Meier analyses (two-sided) of OS based on B7H3 mRNA levels. The data were retrieved from Breast cancer Gene-Expression Miner v4.4 (http://bcgenex.centregauducheau.fr/BC-GEM). All patients were stratified according to intrinsic breast cancer molecular subtypes based on Hu’s SSP as indicated. Median cutoff was chosen in the analysis. d The correlation of B7H3 protein level and its mRNA level using breast cancer samples in TCGA. The TCGA mRNA expression data were retrieved from Gene Expression Omnibus (GSE62944). TCGA protein expression data were measured by The Clinical Proteomic Tumor Analysis Consortium (CPTAC), and were downloaded from CPTAC data portal (https://proteomics.cancer.gov/data-portal). The correlation was assessed using Pearson’s correlation test (two-sided). e Expression of B7H3 protein in 14 representative human TNBC fresh samples by immunoblot. N, matched normal tissue; T, tumor tissue. Red closed circle, glycosylated B7H3. f The representative images of strong B7H3 staining in primary TNBC tissues and weak staining in the matched adjacent noncancer tissues (left). Quantitative IHC analysis of B7H3 (right, two-sided). g The representative intensity images for each IHC score of B7H3 staining in TNBC tumor tissues were shown (left). Kaplan–Meier plots of the overall survival of patients, stratified by expression of B7H3 (right, two-sided). Error bars represent mean ± SD. The p value in a–c, g was assessed using the log-rank test. The p value in (f) was determined by two-tailed Wilcoxon matched-pairs signed-rank test. The data in (e) are representative of three independent experiments.

