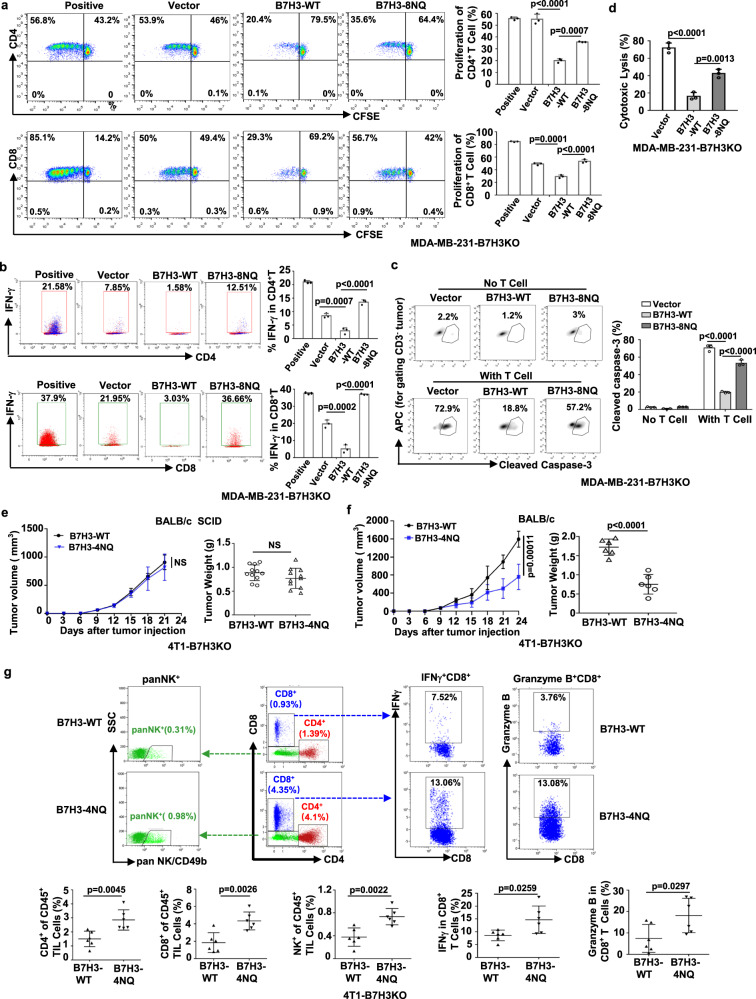
Fig. 4. N-glycosylation of B7H3 inhibits immune responses in TNBC cells.
a, b Left, representative dot plots of in vitro proliferation of T (a) and activation of T (b) measured by fluorescence-activated cell sorting (FACS) as CFSE dilution after 5 days, respectively, of stimulation with anti-CD3 activated T cells alone (positive control) or in the presence of irradiated vector, B7H3-WT or B7H3-8NQ re-expressing in MDA-MB-231-B7H3KO cells. Right, percentage of proliferating CD4+ T, proliferating CD8+ T, IFNγ+CD4+ T and IFNγ+CD8+ T (n = 3 biological independent samples). c The indicated MDA-MB-231-B7H3KO cells were cocultured with CD3/CD28-activated human T-lymphocyte cells. Left, representative dot plots of the cleavage of caspase-3 in tumor cells measured by flow cytometry. Right, percentage of cleaved caspase-3+ tumor cells (n = 3 biological independent samples). d Percent cytotoxicity was assayed by measuring the release of LDH. The indicated MDA-MB-231-B7H3KO cells were cocultured with CD3/CD28-activated human T-lymphocyte cells (n = 3 biological independent samples). e Tumor growth of the indicated mouse 4T1-B7H3KO cells in BALB/c SCID mice. Tumor volumes were calculated (n = 11 mice per group) (left), and tumor weights from experiment on autopsy on day 21 (right). f Tumor growth of indicated mouse 4T1- B7H3KO cells in BALB/c mice. Tumor volumes were calculated (n = 6 mice per group) (left), and tumor weights from experiment on autopsy on day 24 (right). g FACS analysis of CD4+T, CD8+T, panNK+, IFNγ+, and Granzyme B+ in CD8+ T-cell populations from the isolated TILs in (f). Upper, representative dot plots from a representative mouse for each group. Bottom, the percentage of TILs for each group (n = 6 mice per group). Error bars represent mean ± SD. The p value in (a–d) was determined by one-way ANOVA with Dunnett’s multiple comparisons test, no adjustments were made for multiple comparisons. The p value in (e–g) was determined by a two-tailed unpaired Student’s t test. NS, not significance. Data are representative of three independent experiments.

