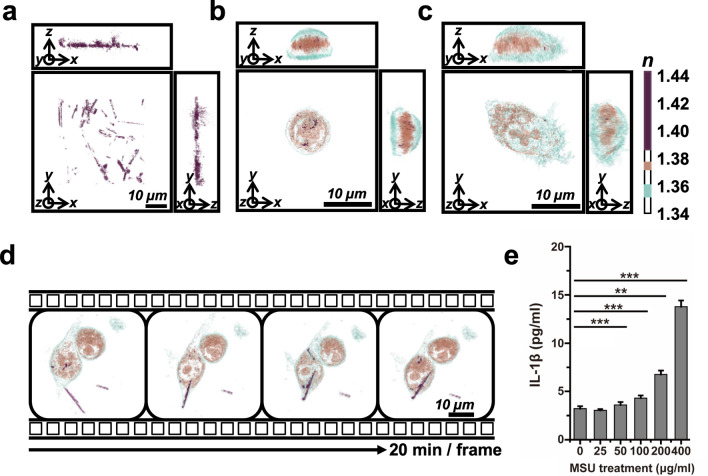
Figure 2.
Three-dimensional (3D) optical diffraction tomography (ODT) of monosodium urate (MSU) crystals. (a) Synthetic MSU crystals were recorded as RI ≥ 1.385. See also Supplementary Movie S1. (b) A monocytic THP-1 cell. (c) A macrophage derived from a THP-1 cell after treatment with phorbol 12-myristate 13-acetate (PMA) for 72 h. The color bar indicates the 3D rendered refractive index (RI) distribution (n = 1.340–1.440). Each square shows the x–y, y–z, or x–z plane. n: refractive index. (d) Time-lapse monitoring of macrophage THP-1 cells after treatment with 10 µg/mL monosodium urate (MSU) crystals for 2 h. The MSU crystals, with RI ≥ 1.385, are indicated in purple. See also Supplementary Movie S2. (e) IL-1β production of THP1 cells assessed via ELISA at 3 h after treatment with MSU crystals. **P < 0.01, ***P < 0.001, ns: not significant.

