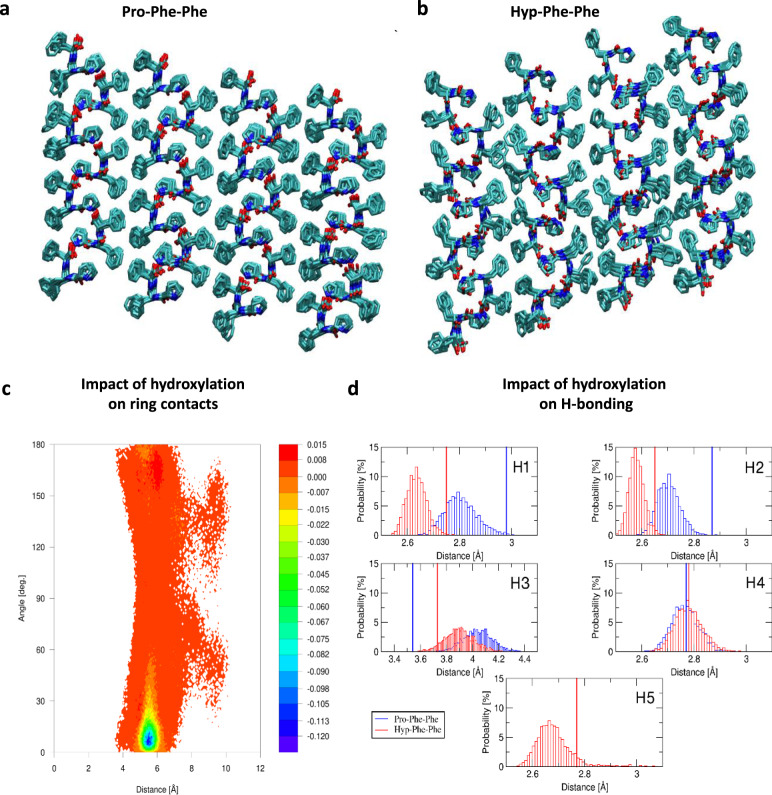
Fig. 3. Molecular dynamics (MD) simulations of Pro-Phe-Phe and Hyp-Phe-Phe assemblies.
a, b The computed supramolecular packing structure in the assemblies after 0.1 µs of room temperature dynamics of Pro-Phe-Phe (a) and Hyp-Phe-Phe (b). The balance between increased H-bonding and more flexible π–π contacts is quantified in the Pro-Phe-Phe vs. Hyp-Phe-Phe difference map in c. The distance corresponds to the distance between neighbouring phenyl rings and the angle to the angle between the same two rings, as described in the ‘Methods’ section. The density is the normalized histogram and is given as a percentage. The 2D histogram is built with a 200 × 200 matrix. H-bond distributions are plotted in d. Additional supporting MD data are provided in Supplementary Figs. 14–19 and Supplementary Table 8.

