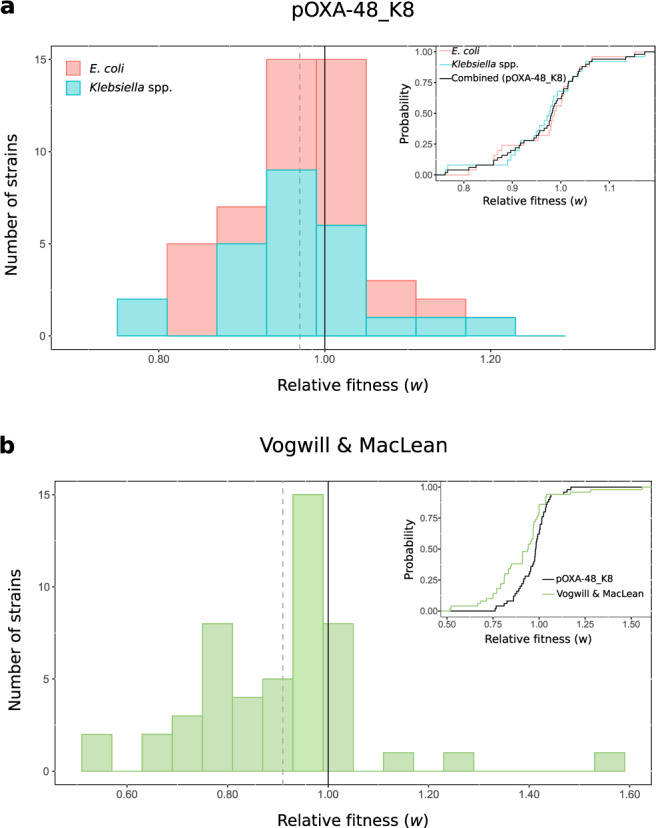
Fig. 3. Distribution of plasmid fitness effects.

Comparison between plasmid fitness effects obtained in this study and those from previous studies. a Distribution of pOXA-48_K8 fitness effects in the ecologically compatible collection of enterobacteria isolates. Bars indicate the number of E. coli (red) and Klebsiella spp. (blue) strains in each relative fitness category. The grey dotted line indicates the mean relative fitness of the population. Note that relative fitness values are normally distributed (w = 0.971, var = 0.0072, one-sided Shapiro–Wilk normality test, P = 0.14). The inset shows the cumulative distribution function (CDF) of the relative fitness of pOXA-48_K8-carrying E. coli (red), Klebsiella spp. (blue) clones, both individually and combined (black). b Distribution of plasmids fitness effects in bacterial hosts obtained in a previous meta-analysis46. Most of the included studies were based on associations between plasmids and bacterial strains from different ecological origins. Bars indicate the number of plasmid–bacterium associations in each relative fitness category. The grey dotted line indicates the mean relative fitness across studies. Relative fitness values are not normally distributed (w = 0.91, var = 0.029; one-sided Shapiro–Wilk normality test, P = 0.0006). The inset shows the CDF of the relative fitness of pOXA-48_K8-carrying enterobacteria analysed in our study (black) and the CDF of the relative fitness of plasmid-carrying bacteria form Vogwill and MacLean meta-analysis (green). Source data are provided as a Source data file.
