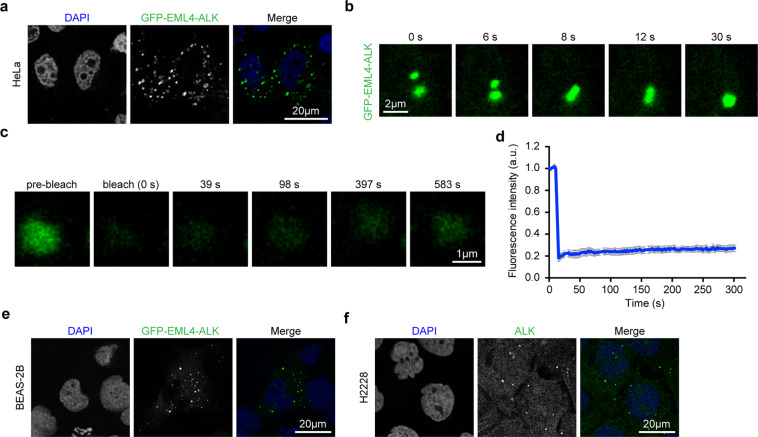
Fig. 1. Phase separation of EML4–ALK variant 1 in human cancer cell lines.
a HeLa cells were transfected with GFP–EML4–ALK for 24 h and the GFP–EML4–ALK was visualized by confocal microscopy. Nucleus was stained with DAPI (blue). Scale bar, 20 μm. b HeLa cells were transfected with GFP–EML4–ALK for 12 h and GFP fluorescence was monitored through live imaging. Snapshots at indicated time points showed the fusion event. Scale bar, 2 μm. c Representative FRAP images of GFP–EML4–ALK condensates in HeLa cells. The images were taken before and after photobleaching. Scale bar, 1 μm. d FRAP recovery curve of GFP–EML4–ALK condensates in HeLa cells. n = 12. Data were shown as mean ± SEM. e BEAS-2B cells were transfected with GFP–EML4–ALK for 24 h and the GFP–EML4–ALK was visualized by confocal microscopy. Nucleus was stained with DAPI (blue). Scale bar, 20 μm. f Immunofluorescence staining analysis of endogenous EML4–ALK in H2228 cells. ALK was indicated in green. Nucleus was stained with DAPI (blue). Scale bar, 20 μm.

