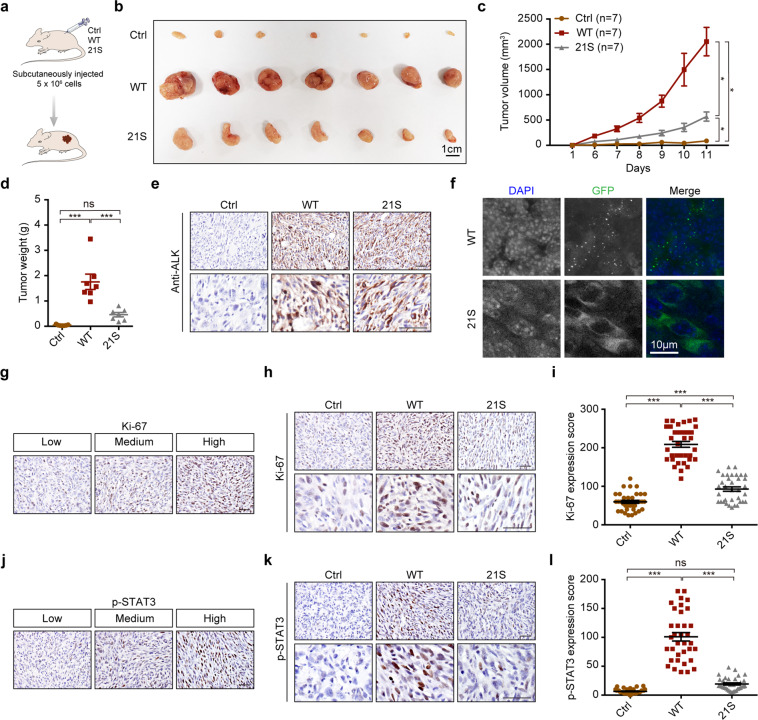
Fig. 7. The EML4–ALK21S mutant exhibits impaired capability in tumor formation.
a Schematic illustration of tumor formation assay in nude mice. See “Materials and methods” for details. b Photos of subcutaneous tumors derived from control, GFP–EML4–ALK and GFP–EML4–ALK21S groups. Scale bar, 1 cm. n = 7 for each group. c Growth curves of the subcutaneous tumors. d Statistical analysis of tumor weights. e Representative photos for ALK immunostaining in subcutaneous tumors derived from control, GFP–EML4–ALK and GFP–EML4–ALK21S groups. Scale bar, 50 μm. f Representative fluorescence photos for subcutaneous tumors derived from GFP–EML4–ALK and GFP–EML4–ALK21S groups. The GFP–EML4–ALK or GFP–EML4–ALK21S was visualized by confocal microscopy. Nucleus was stained with DAPI (blue). Scale bar, 10 μm. g Representative images of low, medium, high expression of Ki-67. Scale bar, 50 μm. h Representative photos for Ki-67 immunostaining in subcutaneous tumors derived from control, EML4–ALK and EML4–ALK21S groups. Scale bar, 50 μm. i Statistical analysis of Ki-67 staining. j Representative images of low, medium, high expression of p-STAT3. Scale bar, 50 μm. k Representative photos for p-STAT3 immunostaining in subcutaneous tumors derived from control, GFP–EML4–ALK and GFP–EML4–ALK21S groups. Scale bar, 50 μm. l Statistical analysis of p-STAT3 immunostaining. All data were shown as mean ± SEM. *P < 0.05; **P < 0.01; ***P < 0.001. Ctrl, control; WT, GFP–EML4–ALK; 21S, GFP–EML4–ALK21S.

