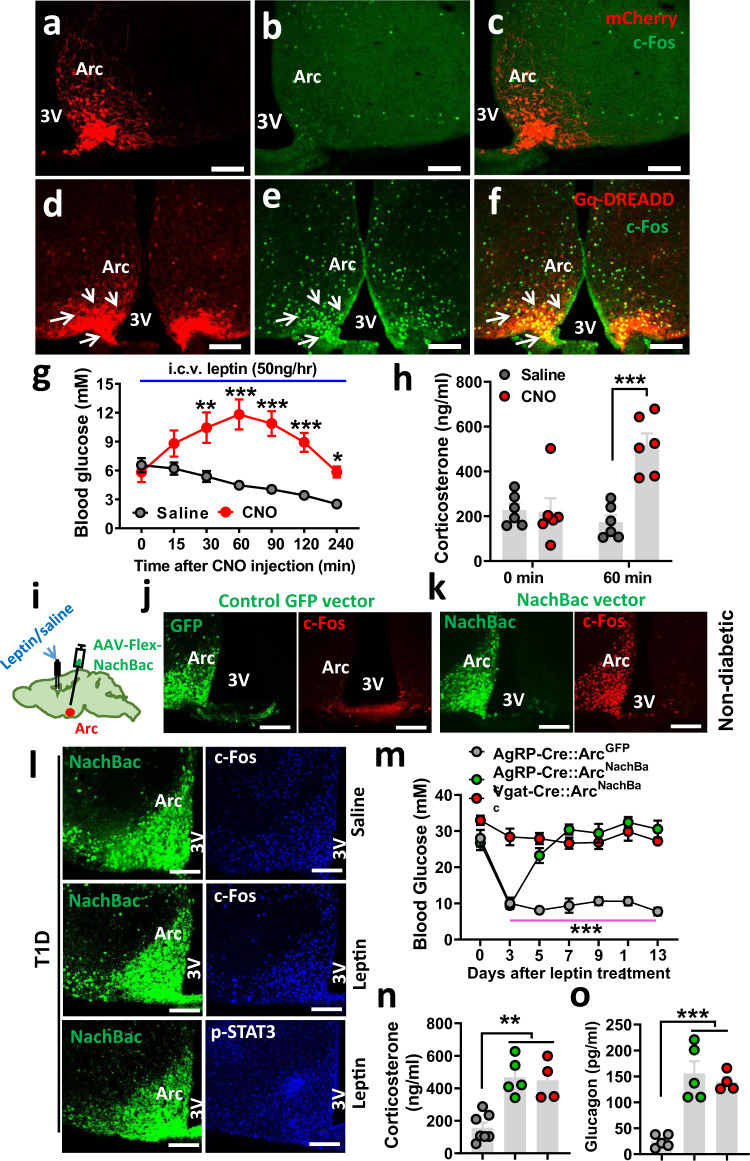
Fig. 2. Activation of Arc neurons reverses leptin action on reducing T1D hyperglycemia.
a–f DREADD-mediated acute activation of Arc LepR neurons reverses the leptin action. LepR-Cre mice were injected with AAV-Flex-mCherry control vectors (a–c) and AAV-DIO-h3MD(Gq)-mCherry (d–f) to bilateral Arc, and expression of mCherry (a, d) and CNO-induced c-Fos (b, e) were confirmed in the Arc. Representative pictures of 6 repeats as shown in g and h. g, h Effects on glucose with single i.p. injection of CNO in T1D LepR-Cre mice with Gq-DREADD delivery to bilateral Arc and euglycemia restoration via i.c.v. leptin infusion (g, two-way ANOVA, n = 6/each, F(1, 70) = 79.47, ***P < 0.0001 (at the 60-min time point); **P = 0.0001 (at the 120-min time point), and comparison in glucagon levels between saline and leptin-treated groups (h, two-way ANOVA, n = 6/each, F(1, 20) = 13.97, ***P < 0.0001, saline vs CNO at the 90-min time point). i–n Effects of NachBac-mediated chronic activation of Arc neurons on the leptin action. i Diagram showing injections of NachBac/or control GFP vectors in AgRP or GABAArc neurons through the delivery of respective vectors to the Arc of AgRP or Vgat-Cre mice, and expression of GFP (green) and c-Fos (red) with one side of the Arc receiving vector injections for control GFP vectors (j) and NachBac vectors (k). l In Vgat-Cre mice that were made T1D and received NachBac vector injections to bilateral Arc with i.c.v. pumps infusing saline or leptin as indicated, representative NachBac expression (GFP, left panels), and c-Fos/p-STAT3 (blue, right panels) are shown. Pictures in (j–l) are representative of three repeats. m Effects on glucose levels in response to i.c.v. infusion of leptin in the indicated groups of mice (two-way ANOVA, n = 6 for AgRP-GFP or AgRP-NachBac, and n = 4 for Vgat-NachBac, F(2, 91) = 190.6, P = 0.9647, AgRP-GFP vs AgRP-NachBac at day 3; ***P < 0.0001, AgRP-GFP vs Vgat-Nachbac at day 3). n, o Measurements and comparison of cort (n, one-way ANOVA, n = 7 for AgRP-GFP, n = 5 for AgRP-NachBac and n = 4 for Vgat-NachBac, F(2, 13) = 16.52, **P = 0.006, AgRP-GFP vs AgRP-NachBac; **P = 0.0017, AgRP-GFP vs Vgat-NachBac) and glucagon (o, one-way ANOVA, n = 5 for AgRP-GFP and AgRP-NachBac, and n = 4 for Vgat-NachBac, F(2, 11) = 21.89, ***P = 0.0002, AgRP-GFP vs AgRP-NachBac; ***P = 0.001, AgRP-GFP vs Vgat-NachBac) levels in the blood at day 13 of i.c.v. leptin infusion shown in panel m. 3V the third ventricle, Arc arcuate nucleus, scale bar: 100 µM. All data presented as mean ± SEM.

