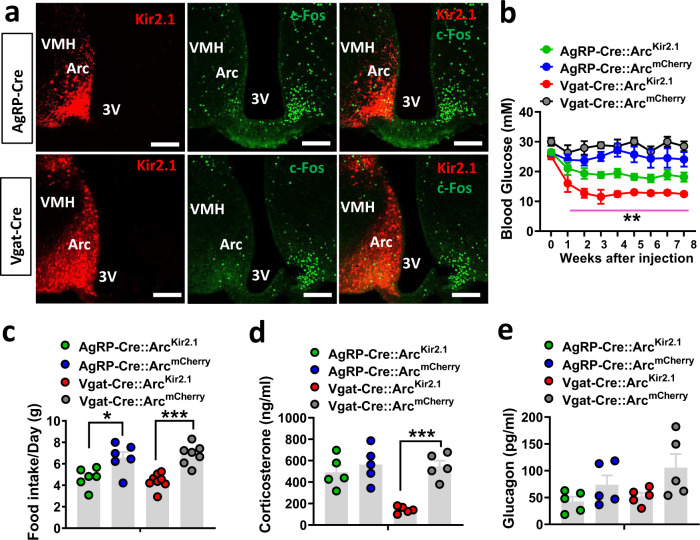
Fig. 4. Chronic inhibition of Arc neurons on T1D glucose.
AgRP-Cre or Vgat-Cre mice (8–10 week-old males) were first made STZ-T1D and then injected with AAV-DIO-Kir2.1-P2A-dTomato vectors or control AAV-Flex-mCherry to bilateral Arc. a Representative sections showing comparison in the expression of Kir2.1 (red) and c-Fos (green) in the Arc of AgRP-Cre mice (top) and Vgat-Cre (bottom), in which the Kir2.1 vector was delivered to one side of the Arc. Representative pictures from n = 2 mice. b–e Weekly glucose levels following injections of the viral vectors (b, two-way ANOVA, n = 6 for AgRP-mCherry, AgRP-Kir2.1, or Vgat-mCherry, and n = 7 for Vgat-Kir2.1, F(3, 189) = 120.1, P = 0.0641, AgRP-mCherry vs AgRP-Kir2.1; **P < 0.0001, Vgat-mCherry vs Vgat-Kir2.1), food intake during week 3–4 after viral delivery (c, two-way ANOVA, n = 6 for both AgRP-mCherry and AgRP-Kir2.1, n = 9 for Vgat-mCherry, and n = 8 for Vgat-Kir2.1, F(3, 23) = 11.68, *P = 0.0149, AgRP-mCherry vs AgRP-Kir2.1; ***P = 0.0003, Vgat-mCherry vs Vgat-Kir2.1) and blood levels of corticosterone (d, two-way ANOVA, n = 5/each, F(3, 16) = 12.16, P = 0.8091, AgRP-mCherry vs AgRP-Kir2.1; ***P = 0.0006, Vgat-mCherry vs Vgat-Kir2.1) and glucagon (e, two-way ANOVA, n = 5/each, F(3,6) = 2.904, P = 0.06, Vgat-mCherry vs Vgat-Gi-DREADD at week 8 after viral injection. 3V the third ventricle, Arc arcuate nucleus. All data presented as mean ± SEM. Scale bar: 100 µM.

