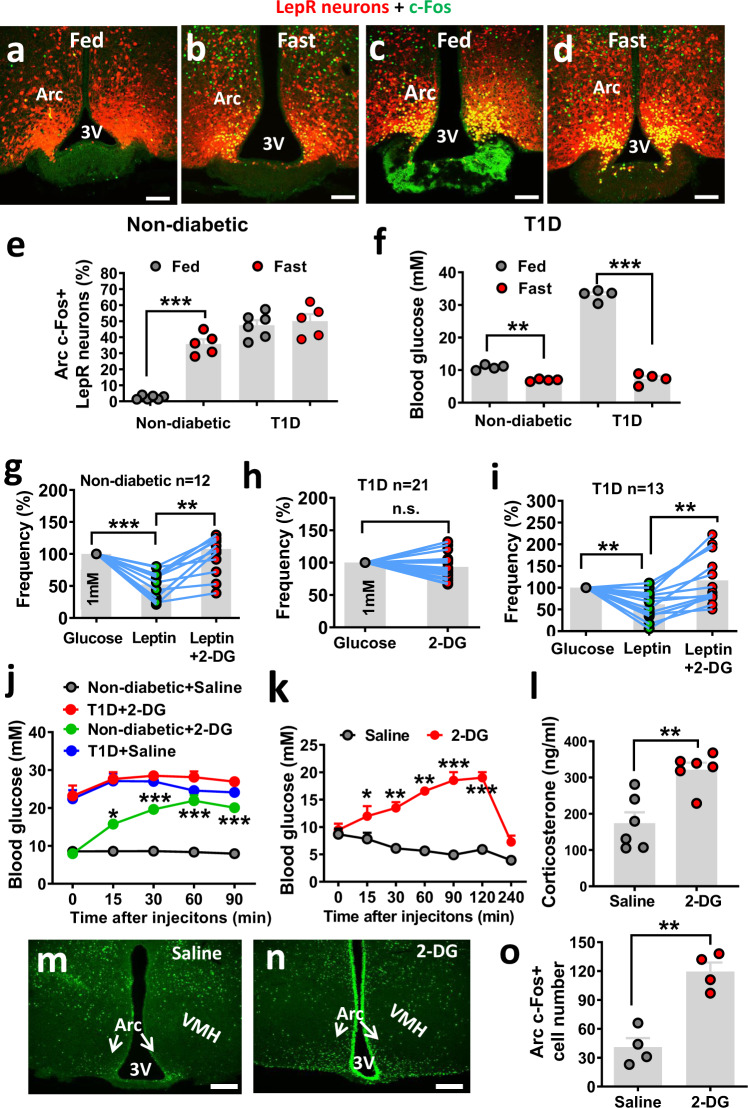
Fig. 6. LepRArc neurons in T1D lose nutrient sensing and restoration by leptin.
a–d LepR-Cre::Ai9 reporter mice (8–10 weeks of age, males) were used either as controls (a, b) or made STZ-T1D (c, d), and were used either at fed (a and c) or overnight fasting conditions (b, d). Representative pictures from n = 5–6 mice showing in e in a–d showing that c-Fos immunostaining was performed and colocalized with LepR neurons. e, f Comparison in the percentage of LepRArc neurons that are c-Fos positive (e, two-way ANOVA, n = 6 for non-diabetic fed and T1D fast, and n = 5 for non-diabetic fed and T1D fast, F(1, 12) = 36.21, ***P < 0.0001, non-diabetic fed vs fast; P = 0.7375, T1D fed vs fast)) and blood glucose levels (f, two-way ANOVA, n = 5/each, F(1. 13) = 526.1, **P = 0.002, non-diabetic fed vs fast; ***P < 0.0001, T1D fed vs fast) between fed and fasting or between controls and STZ groups. 3 the third ventricle, Arc: arcuate nucleus. Scale bar: 100 µM. g–i Electrophysiological recording was performed on LepRArc neurons on brain sections from LepR-Cre reporter mice (8–10 weeks of age, males), which were used as controls (g, one-way ANOVA, F(11, 22) = 1.101, n = 13/each, ***P < 0.0001, glucose vs leptin; **P = 0.0079, leptin vs leptin/2-DG) or made T1D (h, two-tailed unpaired Student’s t tests, n = 21/each, t = 0.1622, df = 40, P = 0.1126, and i, one-way ANOVA, n = 14/each, F(12, 24) = 2.285, **P = 0.0026, glucose vs leptin; **P = 0.0011, leptin vs leptin/2-DG) and LepRArc neurons were recorded for firing frequency in response to leptin and/or 2-DG. Data were expressed relative to baseline firing rates for each recorded neuron. j Comparison in glucose levels in nondiabetic controls and T1D mice treated with i.p. injection of either saline or 2-DG during a period of 90 min after the injection (two-way ANOVA, n = 6/each, F(3, 50) = 159.2, ***P < 0.0001, non-diabetes—saline vs non-diabetes-2-DG, P = 0.4716, T1D-saline vs T1D-2-DG). k–o Groups of wild-type mice (8–10 weeks of age, males) were first made T1D and were then implanted with both i.c.v. minipump for leptin infusion and i.c.v. cannulas for brain injection of 2-DG or saline. Brain injections of 2-DG or saline were performed after leptin-mediated euglycemia restoration. Blood glucose was measured following i.c.v. injection of 2-DG at the indicated time points (k, two-way ANOVA, n = 6/each, F(1, 35) = 240.1, ***P < 0.0001, saline vs 2-DG at the 120-min time point) and corticosterone levels were measured at 90 min after 2-DG injections (l, two-tailed unpaired Student’s t tests, t = 4.108, df = 10; n = 6/each, **P = 0.0021). Brain sections were used for c-Fos immunostaining from i.c.v. saline (m) and 2-DG treatments (n) at 90 min after i.c.v. 2-DG injection, and neuron number with c-Fos expression was compared between these two groups (o, two-tailed unpaired Student’s t tests, t = 5.885, df = 6, n = 4/each, **P = 0.0011). Data presented as mean ± SEM. 3V the third ventricle, Arc arcuate nucleus, VMH ventromedial hypothalamus. Scale bar: 100 µM.

