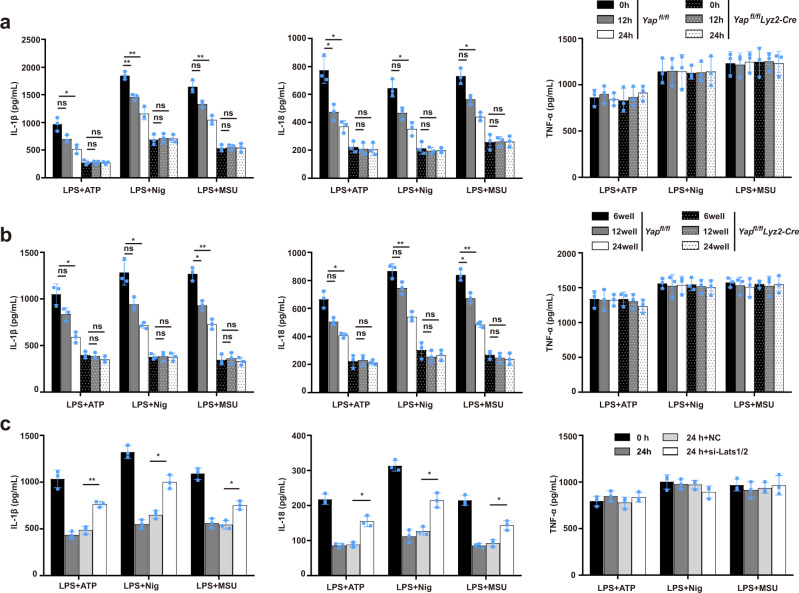
Fig. 3. Hippo signaling suppresses the NLRP3 inflammasome activation in a YAP-dependent manner.
a, b ELISA of IL-1β, IL-18, and TNF-α in supernatants of mouse peritoneal macrophages from Yapfl/fl lyz2-Cre and Yapfl/fl mice treated with serum starvation for indicated times (a) or seeded into different confluence (b), then applied with indicated stimuli (for a, mean ± SD, two-way ANOVA with Bonferroni test, left panel:12 h and 24 h vs. 0 h in Yapfl/fl or Yapfl/fl lyz2-Cre group, ns = 0.1243, *P = 0.0267, ns > 0.9999, ns > 0.9999, **P = 0.0065, **P = 0.0055, ns > 0.9999, ns > 0.9999, ns = 0.0661, **P = 0.0069, ns > 0.9999, ns > 0.9999 in sequence; middle panel:12 h and 24 h vs. 0 h in Yapfl/fl or Yapfl/fl lyz2-Cre group, *P = 0.0448, *P = 0.0261, ns > 0.9999, ns > 0.9999, ns = 0.06, *P = 0.0113, ns > 0.9999, ns > 0.9999, ns = 0.0557, *P = 0.0127, ns > 0.9999, ns > 0.9999 in sequence; n = 3 independent experiments. For b, mean ± SD, two-way ANOVA with Bonferroni test, left panel: 12-well and 24-well vs. 6-well in Yapfl/fl or Yapfl/fl lyz2-Cre group, ns = 0.1743, *P = 0.0239, ns > 0.9999, ns = 0.5177, ns = 0.0861, *P = 0.0408, ns > 0.9999, ns > 0.9999, *P = 0.0115, **P = 0.0021, ns > 0.9999, ns > 0.9999 in sequence; middle panel: 12 h and 24 h vs. 0 h in Yapfl/fl or Yapfl/fl lyz2-Cre group, ns = 0.0969, *P = 0.0386, ns > 0.9999, ns > 0.9999, ns = 0.1, **P = 0.0038, ns > 0.9999, ns > 0.9999, *P = 0.0205, **P = 0.0032, ns > 0.9999, ns > 0.9999 in sequence; n = 3 independent experiments). c ELISA of IL-1β, IL-18, and TNF-α in supernatants from mouse peritoneal macrophages silenced of Lats1/2 and treated with serum starvation for indicated times, then applied with indicated stimuli (mean ± SD, two-way ANOVA with Bonferroni test, si Lats1/2 24 h vs. si Ctrl 24 h, left panel: **P = 0.0031, *P = 0.0107, *P = 0.0492 in sequence; middle panel: *P = 0.0492, *P = 0.0393, *P = 0.0478 in sequence; n = 3 independent experiments). Source data are provided as a Source Data file.

