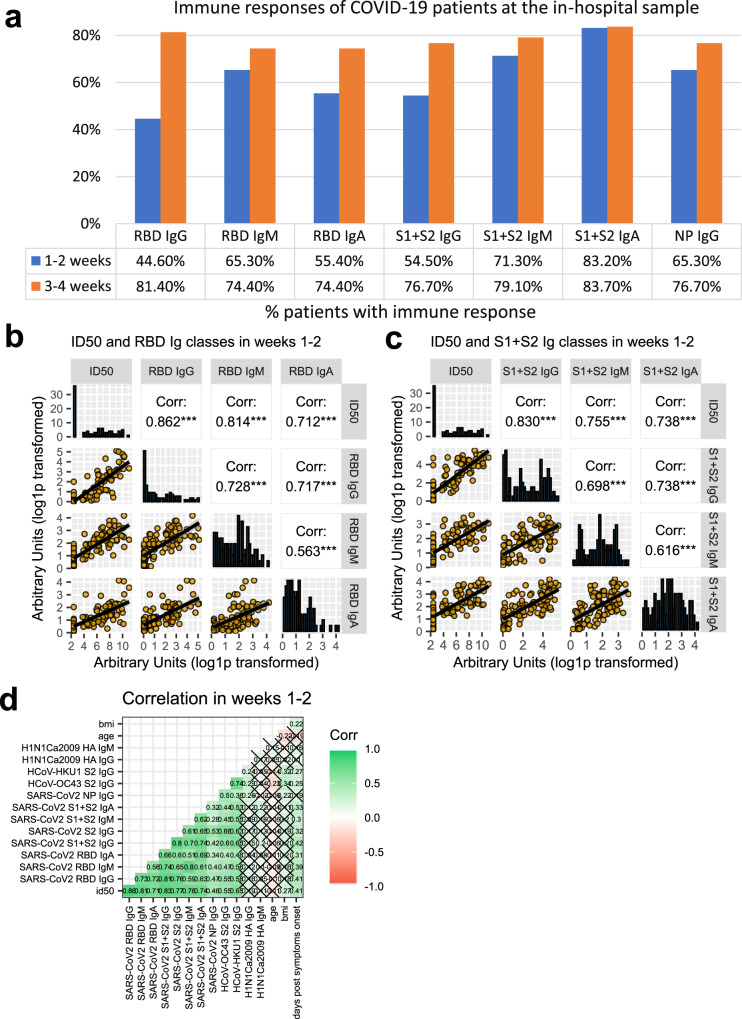
Fig. 3. Anti-SARS-CoV-2 Spike neutralizing and binding antibody profile.
a Indicated is the percent of 150 COVID-19 patients tested at the in-hospital visit, that had IgG, IgM, and IgA to SARS-CoV-2 antigens detected with LIPS, when sampled during the first or second two weeks from symptoms onset. b, c Sera of COVID-19 patients, collected at the indicated timepoints from symptoms onset, were measured by LV-based-neutralization assay and the LIPS indicated in gray labels above each row/column. In (b) are Ig to RBD and in (c) Ig to S1 + S2. Boxes under the diagonal show each correlation plot of the reciprocal of ID50 and arbitrary units after log1p conversion. Dots correspond to individual measurements, the black line represents the regression line and the gray area is 95%CI. Boxes on the diagonal show as histograms the distribution of values in each assay. Boxes above the diagonal show the corresponding Pearson correlation analysis coefficients. Asterisks correspond to the following p values: ***p ≤ 0.001; **p ≤ 0.01; *p ≤ 0.05. d Correlation matrix of the indicated variables in weeks 1–2. For each pair, Pearson’s correlation coefficient is shown as number and on a color scale. Statistically non-significant correlations are crossed. Source data are provided as a Source Data file.

