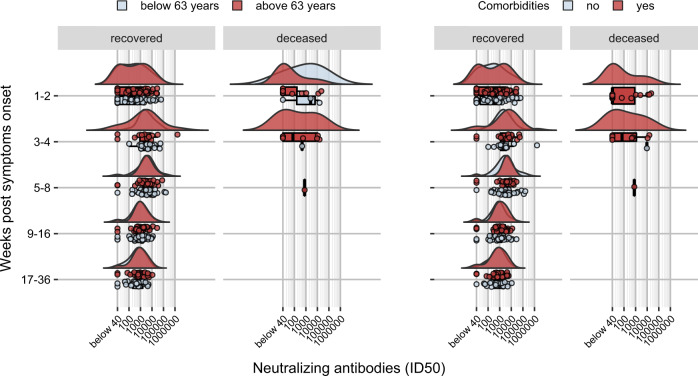
Fig. 5. Development and kinetics of the nAb response according to age or co-morbidities.
Raincloud plot of each patient’s nAb response (circles) expressed as the reciprocal of the ID50 titer. Patients are stratified by time from symptoms onset at sampling (vertical panels, weeks) and clinical outcome (recovered or deceased). Patients are further stratified as below or above the median age of the overall study population (<63 years = blue, >63 years = red) or according to the presence of any co-morbidity (present = red, absent = blue). Shown are the probability density estimate (with the half violin plot upscaled to maximum width for better visualization) and box plots displaying median, IQR, and whiskers extending to 1.96 times the IQR. Source data are provided as a Source Data file.

