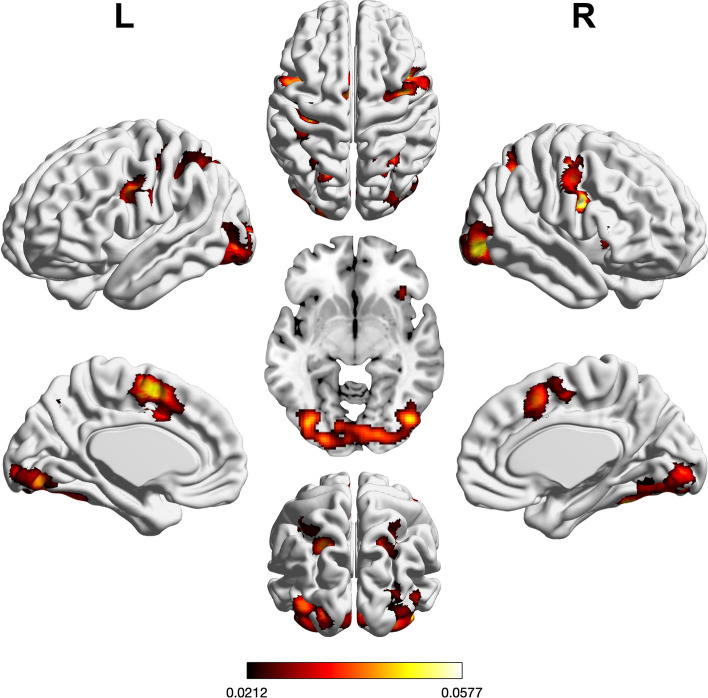
Figure 2.
Foci of brain activity showing significant across-experiment convergence of activity related to visual processing (cluster-level p < 0.05, family-wise error-corrected for multiple comparisons, cluster-forming threshold at voxel level: p < 0.001). The scale bar reflects activation likelihood estimation scores. Cortical and cerebellar clusters of convergence were visualized with the BrainNet Viewer24; subcortical clusters were rendered on the individual anatomical template (“ch2better”) provided with MRIcron25.

