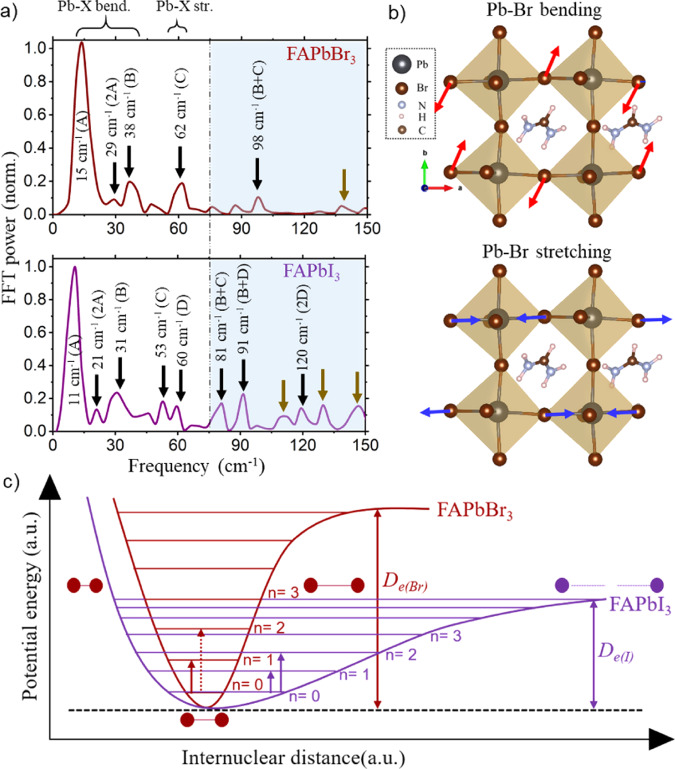
Fig. 3. Anhamonicity in FAPbX3 PNCs.
a The FFT power spectrum of the FAPbBr3 PNCs at 510 nm and FAPbI3 PNCs at 695 nm probe, respectively, computed over the first 10 ps time delay. The vertical dot-dashed line at 75 cm−1 separates two regions of interest. The data shown are averaged over two datasets obtained from twice-repeated experimental observations. b Schematic of bending and stretching modes (red and blue arrows, respectively) in FAPbBr3. c Schematic illustration of potential energy as a function of internuclear distance along with Pb-X bending (A-mode) coordinate, showing the extent of anharmonic character in FAPbBr3 and FAPbI3, as interpreted from the FFT analysis for the A-mode. De stands for the bond dissociation energy.

