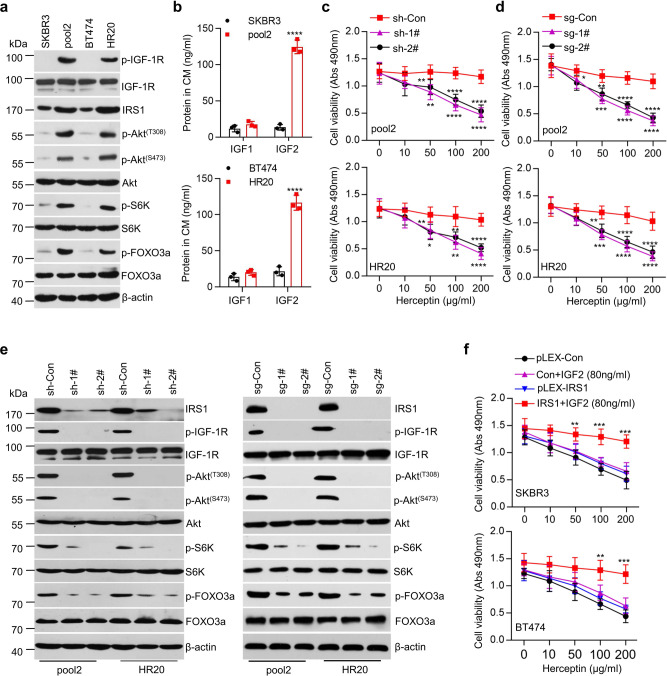
Fig. 1. IGF2/IGF-1R/IRS1/Akt/mTOR signaling pathway was involved in resistance to Herceptin in HER2-positive breast cancer cells.
a SKBR3, pool2, BT474, and HR20 cells cultured at normal condition were collected and subjected to western blot analyses of p-IGF-1R, IGF-1R, IRS1, p-Akt(T308), p-Akt(S473), Akt, p-S6K, S6K, p-FOXO3a, FOXO3a, and β-actin. b The levels of IGF1 and IGF2 in conditioned medium (CM) were measured by ELISA, ****p < 0.0001. c Pool2 or HR20 cells stably transfected with control shRNA (sh-Con) or IRS1-targeting shRNAs (sh-1#, sh-2#) were treated with Herceptin at indicated concentrations for 72 h. Cell viability was evaluated by MTS assays, Pool2 sh-1#: **p = 0.0021, ****p < 0.0001, sh-2#: **p = 0.0096, ****p < 0.0001, HR20 sh-1#: *p = 0.0154, **p = 0.0015, ****p < 0.0001, sh-2#: **p = 0.0072, **p = 0.0034, ****p < 0.0001. d Pool2 or HR20 cells with IRS1 deletion via CRISPR-Cas9 gene editing (sg-Con vs sg-1# and sg-2#) were treated with Herceptin at indicated concentrations for 72 h. Cell viability was evaluated by MTS assays, Pool2 sg-1#: ***p = 0.0002, ****p < 0.0001, sg-2#: *p = 0.0235, **p = 0.0017, ****p < 0.0001, HR20 sg-1#: ***p = 0.0003, ****p < 0.0001, sg-2#: **p = 0.0023, ****p < 0.0001. e Downregulation of IRS1 was achieved with either specific shRNAs (sh-Con vs sh-1# and sh-2#) or CRISPR-Cas9 gene editing (sg-Con vs sg-1# and sg-2#) in Pool2 or HR20 cells. The expression of IRS1, p-IGF-1R, IGF-1R, p-Akt(T308), p-Akt(S473), Akt, p-S6K, S6K, p-FOXO3a, FOXO3a, and β-actin was measured by western blot assays. f SKBR3 and BT474 cells were stably transfected with control vector (pLEX-Con or Con) or IRS1-overexpressing vector (pLEX-IRS1 or IRS1) followed by treatment with rhIGF2 (80 ng/ml) in combination with Herceptin at indicated concentrations for 72 h. Cell viability was evaluated by MTS assays, SKBR3 IRS1 + IGF2: **p = 0.0059, ***p = 0.0002, ***p = 0.0003, BT474 IRS1 + IGF2: **p = 0.0038, ***p = 0.0004. n = 3 biological independent samples (b–d, f). Data are presented as mean values ± SEM (b–d, f). Statistical significance was determined by a two-tailed Student’s t-test (b–d, f). Data show a representative of three independent experiments (a, e). All data are provided in the Source Data file.

