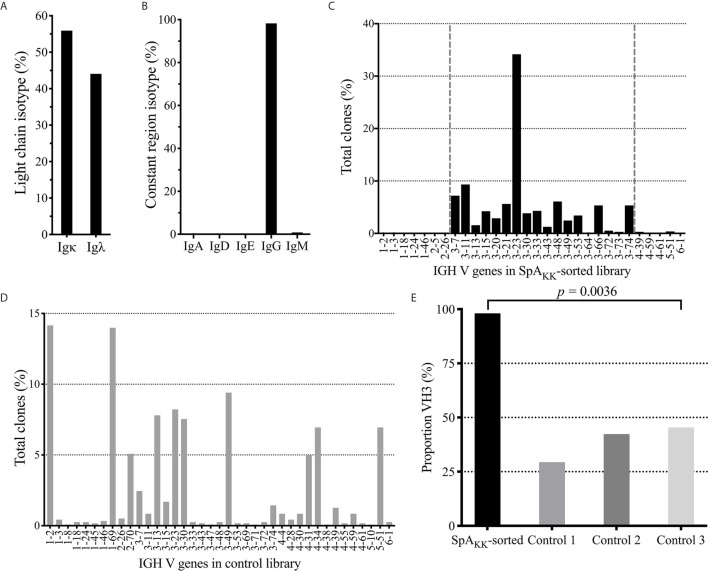
Figure 3.
Repertoire analysis of SpAKK-sorted memory B cells and unsorted peripheral B cells from healthy controls. (A) Isotype usage as a % of total in SpAKK-sorted repertoire. (B) Light chain usage as a % of total in SpAKK-sorted repertoire. (C) Gene usage as % of total clones identified in sequenced SpAKK-sorted repertoire. Clones mapped to the VH3 gene family are highlighted between the two vertical dashed lines. (D) Gene usage as % of total clones identified in the total memory B cell repertoire of a healthy control donor (Control 1). (E) Proportion of VH3 encoded BCR in repertoire in the SpAKK-sorted peripheral memory B cells compared to three individual healthy controls.

