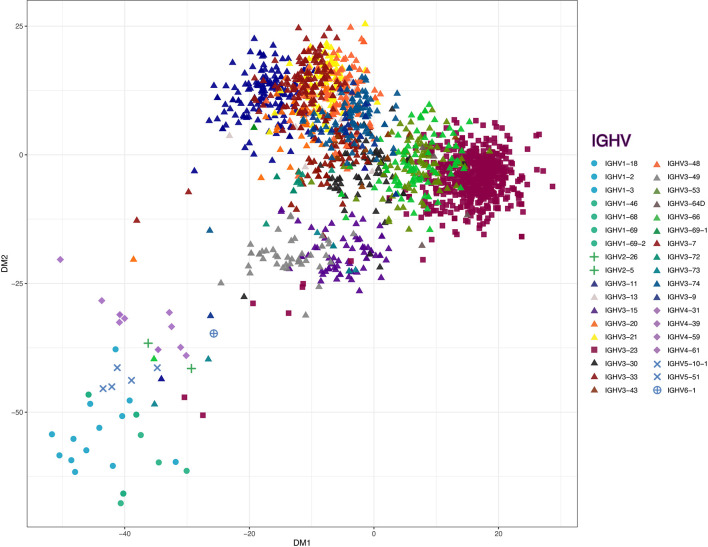
Figure 4.
Classical multidimensional scaling on sequence dissimilarity matrix of the VDJ regions from all of the B cell transcripts. Matrix is derived from pairwise longest common substring distance of the all VH sequences from sorted B cells, with dissimilarity between these antibody gene rearrangements depicted in two-dimension. The non-VH3 (circles - VH1, pluses - VH2, diamonds - VH4, ‘X’s - VH5 and sun crosses - VH6), VH3-23 (squares) and VH3-other than from the VH3-23 germline gene (VH3-non23) (triangles) are depicted on the plot. Individual genes are marked with unique colors.

