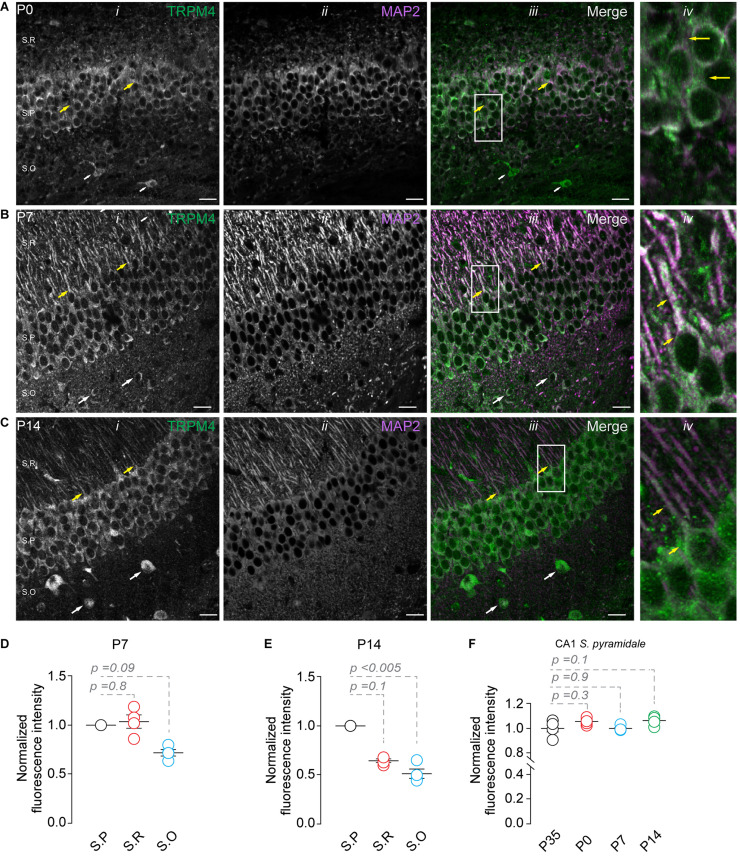
FIGURE 2.
TRPM4 expression in CA1 pyramidal neurons during postnatal development. Confocal images showing double labeling of TRPM4 (Alexa 488, green, i) with MAP2 (Alexa 546, magenta, ii), the merged signals (iii), and (iv) shows a zoomed area (white rectangle), yellow arrowheads showed neurons in the stratum pyramidale and the distribution in the soma and proximal apical dendrite; white arrowhead shows the distribution in the stratum oriens, showing the expression in the somatic region of the neurons. (A) Shows the expression of TRPM4 and MAP 2 at P0, (B) Shows the expression at P7, and (C) Shows the expression at P14. (D,E) Graphs of normalized fluorescence intensity of TRPM4 in S.P, S.R, and S.O of area CA1 of P7 and P14. Fluorescence intensity values were normalized to CA1 S.P. for each mouse. Each point corresponds to an individual mouse (Kruskal Wallis followed by Dunn’s post hoc test vs. CA1 S.P; n = 4 mice). (F) Graph of normalized fluorescence intensity of TRPM4 in S.P, from P0, P7, P14, and P35 mice. Fluorescence intensity values were normalized to mean intensity values of CA1 S.P of P35 mice. Each point corresponds to an individual mouse (Kruskal Wallis followed by Dunn’s post hoc test vs. CA1 S.P, P35; n = 4–5 mice). S.P, stratum pyramidale; S.R, stratum radiatum; and S.O, stratum oriens. Calibration bars = 20 μm.

