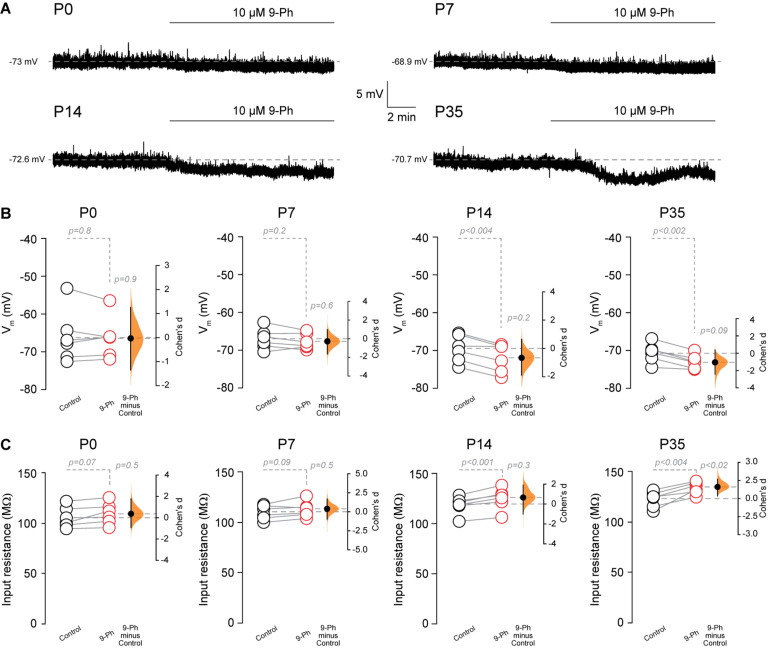
FIGURE 4.
TRPM4 inhibition hyperpolarizes CA1 pyramidal neurons during postnatal development. (A) Representative perforated-patch voltage trace recorded in pyramidal neurons showing the effect of 10 μM 9-Ph at P0, P7, P14, and P35. (B) Summary plots showing resting membrane potential and the effect of 10 μM 9-Ph at P0 (n = 6), P7 (n = 6), P14 (n = 6), and P35 (n = 6). (C) Summary plots showing the effect of 9-Ph on the input resistance at P0 (n = 6), P7 (n = 6), P14 (n = 6), and P35 (n = 6; statistical difference were determined using a one-way ANOVA, p-values are show above each group). On the right side of each plot the paired mean difference between the conditions is shown; the mean difference is depicted as a dot; the 95% confidence interval is indicated by the end of the vertical error bar. Statistical differences were evaluated using paired t-test and p-values are shown above. Each point corresponds to an individual mouse (1 slice per mouse).

