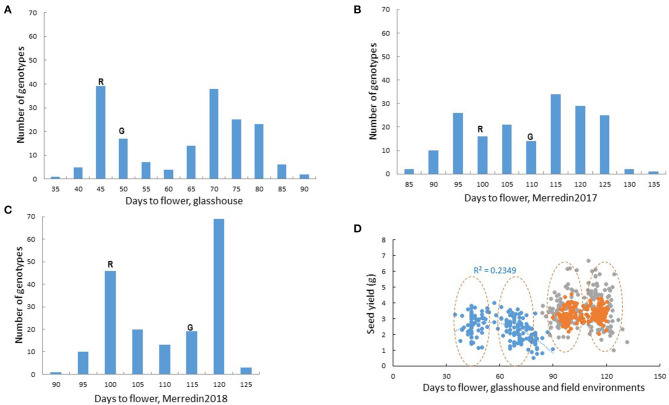
Figure 2.
Flowering in the Rupali/Genesis836 RIL mapping population. Bimodal distribution for flowering time in the RIL population in (A) the glasshouse (B) Merredin2017 and (C) Merredin2018. Days to flower for the parents, Rupali(R) and Genesis836(G) is indicated. Transgressive segregation for flowering was evident in all the environments. (D) Influence of flowering on seed yield in the glasshouse and two field environments under non-saline conditions. Blue dots represent glasshouse data, gray dots represent data from Merredin2017 and orange dots represent data from Merredin2018. Generally, genotypes clustered into “early” and “late” groups as indicated by the dashed circles. Very early and very late flowering genotypes in the glasshouse had lower yields compared to the rest of the lines, a phenomenon that was not observed in the field.

