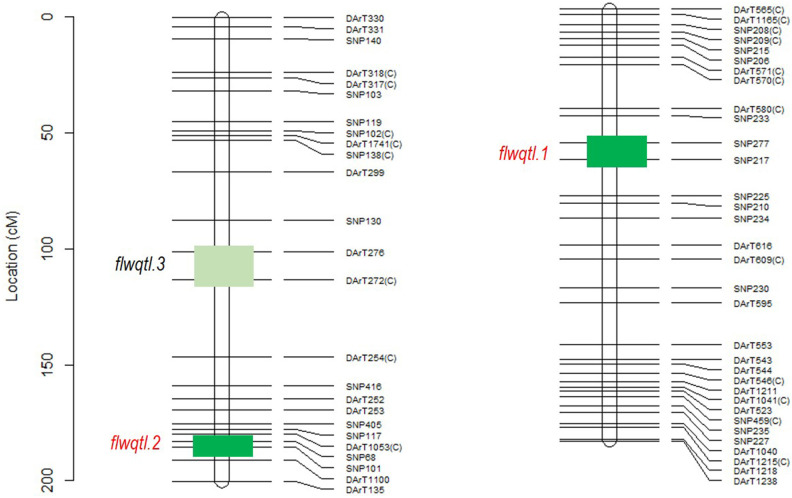
Figure 3.
QTL analysis of flowering loci segregating in Rupali/Genesis836 population across three different environments; glasshouse, Merredin2017, and Merredin2018 under non-saline conditions. Green boxes show approximate genomic regions where the flowering loci map. Flowering QTL, flwqtl.3 on CaLG03 was only identified in Merredin2018 while flwqtl.1 and flwqtl.2 on CaLG05 and CaLG03, respectively, were identified in the glasshouse, Merredin2017 and Merredin2018 by both single environment QTL analysis and multi-environment QTL analysis. %GVE-percent genotypic variation explained.

