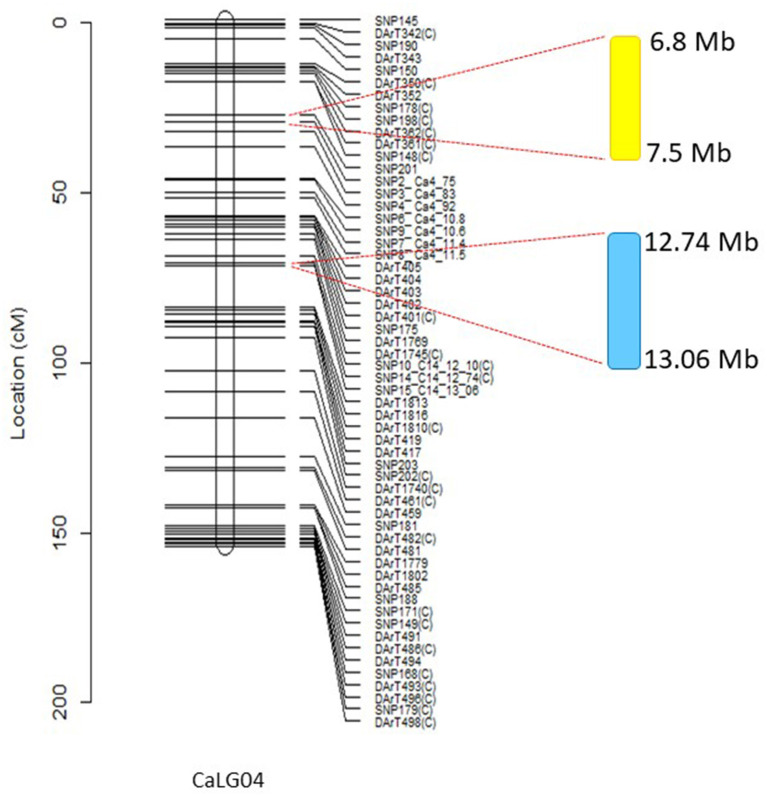
Figure 4.
Major salinity and seed yield or biomass-related QTL on CaLG04. Genomic region highlighted in yellow shows the location of multiple salinity-specific QTL associated with necrosis scores and salinity tolerance per se, calculated from residuals from regressions of traits measured in salinity onto corresponding control values. These traits included number of filled pods, seed number, and seed yield. Genomic region highlighted in blue relates to the position of QTL for traits controlling 100-seed weight, above ground biomass, and seed number in both control and salt treatments across different environments. Physical positions of molecular markers flanking the QTLs are provided using the Kabuli reference assembly v.2.

