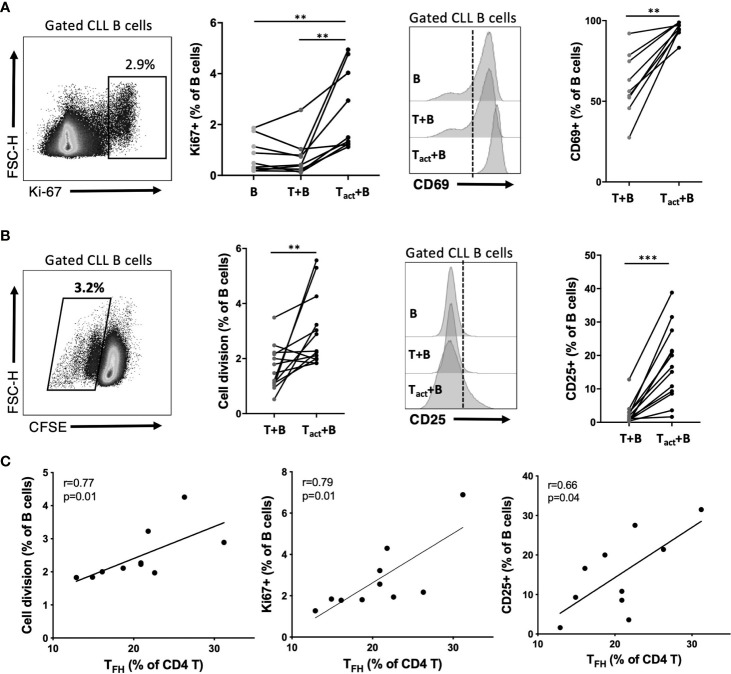
Figure 7.
Impact of activated autologous CD4+ T cells on CLL activation and proliferation. Purified CLL cells were co-cultured with purified autologous CD4+ T cells from the same PBMC sample. Prior to co-culture, CLL cells were labeled with CFSE and T cells were briefly exposed to an activation cocktail (Tact) or kept in medium alone (T). After 2 or 6 days of co-culture, cells were analyzed by flow cytometry to determine cell division and expression of activation markers. B cells were gated as live CD19+CD4- cells. (A) Expression of nuclear proliferation antigen Ki67 or activation marker CD69 at day 2 of culture. (B) CLL cell division assessment based on CFSE dilution and expression of activation marker CD25 at day 6 of culture. In (A, B) *denotes significance by Wilcoxon paired t test, **(p<0.01), ***(p<0.001). (C) Correlation of observed B cell division, Ki67 expression or CD25 expression with the frequency of TFH within CD4 T cells for each patient sample cultured (Spearman correlation).

