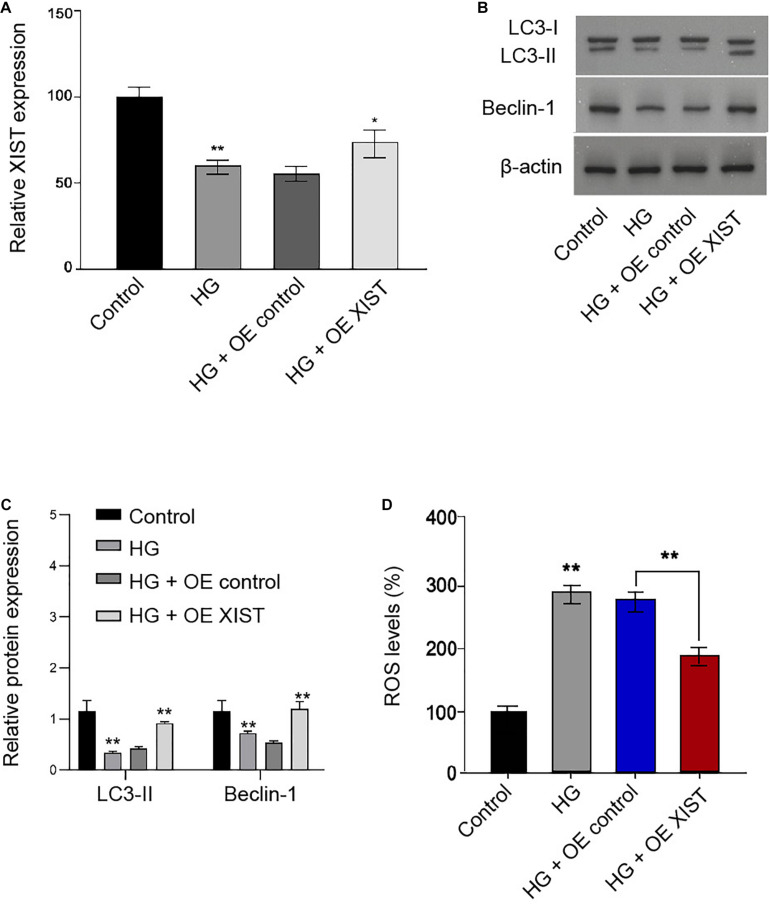
FIGURE 3.
XIST induces autophagy and inhibits oxidative stress in the HG-treated Schwann cells. (A–D) The RSC96 cells are treated with HG, or co-treated with HG and pcDNA-3.1-XIST overexpression vectors. (A) The expression of XIST is measured by qPCR assays. (B,C) The expression of LC3I, LC3II, and Beclin-1 is assessed by Western blot analysis. (D) DCFH–DA staining shows the ROS production. N = 3, mean ± SD, *P < 0.05, **P < 0.01.

