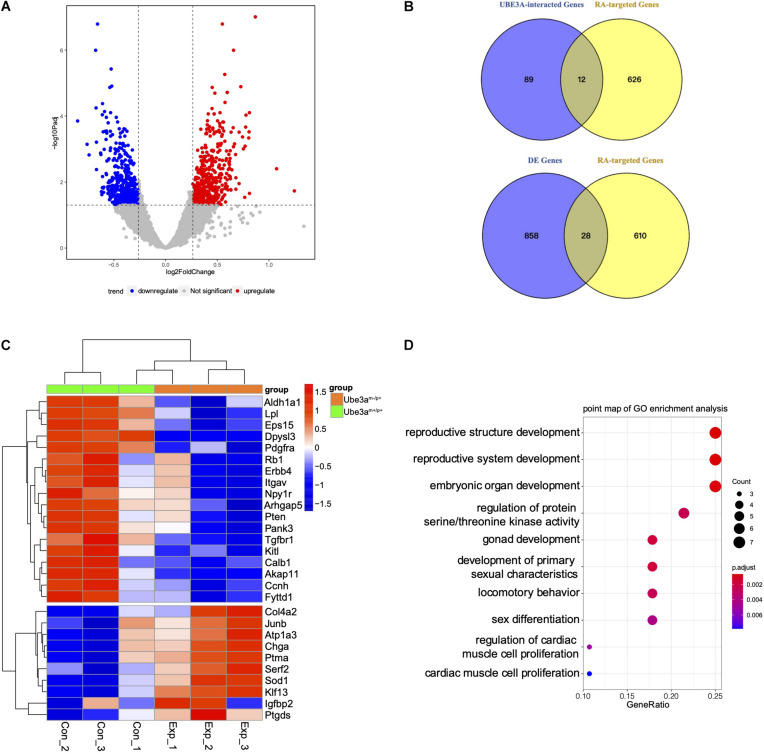
FIGURE 1.
Gene expression profiling in the hippocampus of mice. (A) Volcano plot analysis from the hippocampus of Ube3am–/p+ mice and Ube3am+/p+ mice (Foldchange > 1.2; P < 0.05). (B) Venn analysis was used for enrichment between the most related to UBE3A and RA-regulated genes or differentially expressed genes. (C) Comparison of convergent differential RA-targeted genes expression between Ube3am+/p+ and Ube3am–/p+ mice. The mean numbers of reads were used. Mouse samples were divided into two groups: Ube3am+/p+ mice (n = 3) and Ube3am–/p+ mice (n = 3). (D) Enriched Biological Process pathway in GO analysis (P < 0.05).

