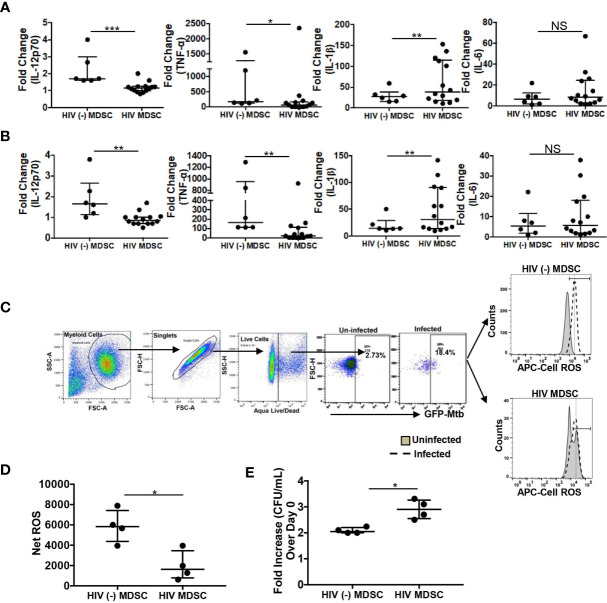
Figure 1.
Suppressed innate immunity of HIV MDSC in response to M tuberculosis. PBMC from HIV (-) and HIV (+) donors on cART and with virologic suppression was surface stained with anti-CD -11b, -33, -14 and HLA DR antibodies. CD11b+CD33+CD14+HLA DR-/lo MDSC were isolated by flow cytometry and named as HIV (-) MDSC and HIV MDSC, respectively. (A, B) Cells were either infected with M tuberculosis (A) or cultured with M tuberculosis whole cell lysate (B). The amount of cytokines were measured in the culture supernatants and fold change was calculated as Quantity in presence of M tuberculosis/Quantity in absence of M tuberculosis. (C, D) MDSC were infected with GFP expressing M tuberculosis (Mtb-GFP) at multiplicity of infection (MOI) 1:5 for 2-hrs. During last 30-mins of infection 1μM of CellROX deep read reagents was added and subsequently stained with aqua fluorescent LIVE/DEAD stain. Expression of ROS (CellROS) in Mtb-GFP+ Live cells was determined by flow cytometry (MFI, Mean Fluorescence Intensity). Net ROS expression was calculated as in Materials and Methods. Representative flow cytometry plot of one HIV (-) MDSC and HIV MDSC donor is shown; vertical line is median. (E) MDSC cells were infected with M tuberculosis at MOI of 1:5 for 3-hrs, washed with PBS to remove extracellular bacteria, M tuberculosis growth (colony forming units (CFU)/ml) was determined in the cellular lysates at day-0 and day-5 post-infection. The fold increase in intracellular bacterial replication was measured as CFU/ml at Day-0/CFU/ml at Day-5. For (A, B, D, E), each dot representing an individual donor include observations from 25th to 75th percentile; the horizontal line represents the median value. *p < 0.05, **p < 0.005, ***p < 0.0005. NS, Non Significant.

