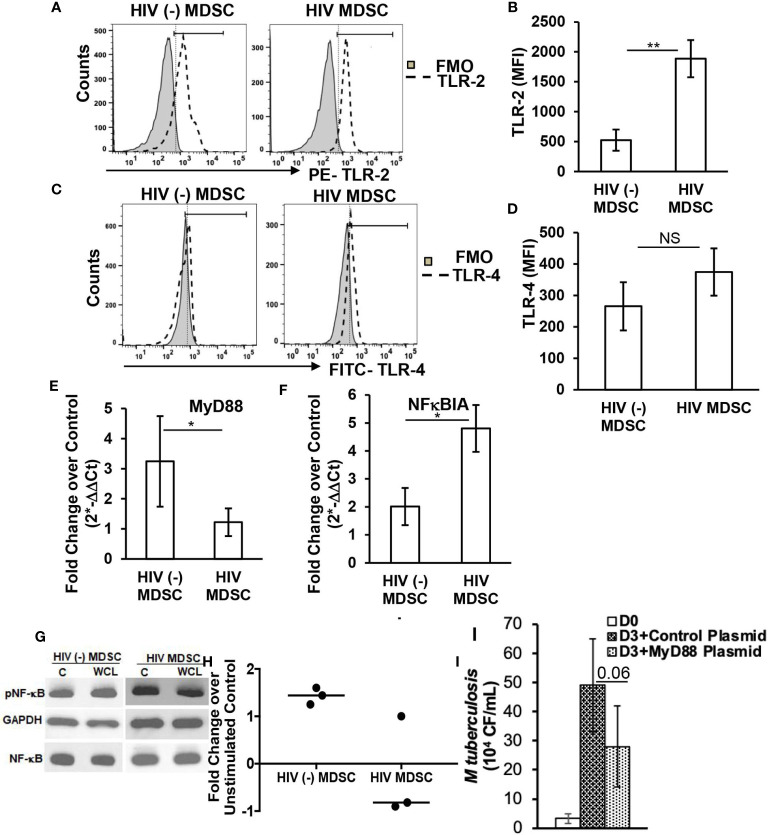
Figure 2.
HIV MDSC exhibit truncated TLR signaling. HIV (-) MDSC and HIV MDSC were isolated as in Figure 1 . MDSC were surface stained with (A, B) anti- TLR2 and (C, D) anti-TLR4 antibodies. The expression of TLR-2 and -4 was determined by flow cytometry and Mean Fluorescence Intensity (MFI) calculated. Representative flow cytometry plots of TLR-2 and -4 are shown; vertical line is median. (E, F) MDSC were cultured without or with M tuberculosis WCL for 24-48 hours, expression of housekeeping gene 18S RNA and MyD88 (E) and NFκBIA (F) and was determined using TaqMan Gene expression assay, and ΔΔCT= ΔCT,WCL-ΔCT,control. The fold change was calculated as . (G, H) Total cellular lysates of MDSC cultured without or with M tuberculosis WCL were prepared and immunoblotted using anti-GAPDH, -total NFκB p65 and –p(S536)NFκB p65 antibody. Fold change was calculated as pNFκB p65 expression in M tuberculosis WCL stimulated cells/pNFκB p65 expression in unstimulated cells. Representative Immunoblot of one HIV (-) and HIV (+) donor is shown (G). (I) 0.5 x 10⁶ MDSC were transfected with empty vector (Control plasmid) or MyD88 containing expression plasmid (MDSC) using Lipofectamine 3000 reagent. After 16-18 hrs post-transfection, DRhi monocytes and MDSC were infected with M tuberculosis at MOI of 1:5 and M tuberculosis growth (colony forming units (CFU)/ml) was determined in the cellular lysates at day-0 and -3 post-infection (p.i.). For (B, D) histograms are shown for N=9 HIV (-) and N= 17 HIV (+) donors; for (E, F) histograms are shown for N= 6 HIV (-) and N= 8 HIV (+) donors; for (H) dot represents an individual donor; horizontal line represents the median; for (I) histograms shown are for N=3 donors. All histograms show mean values +/- SEM. *p < 0.05, **p < 0.005. NS, Non Significant.

