Figure 3.
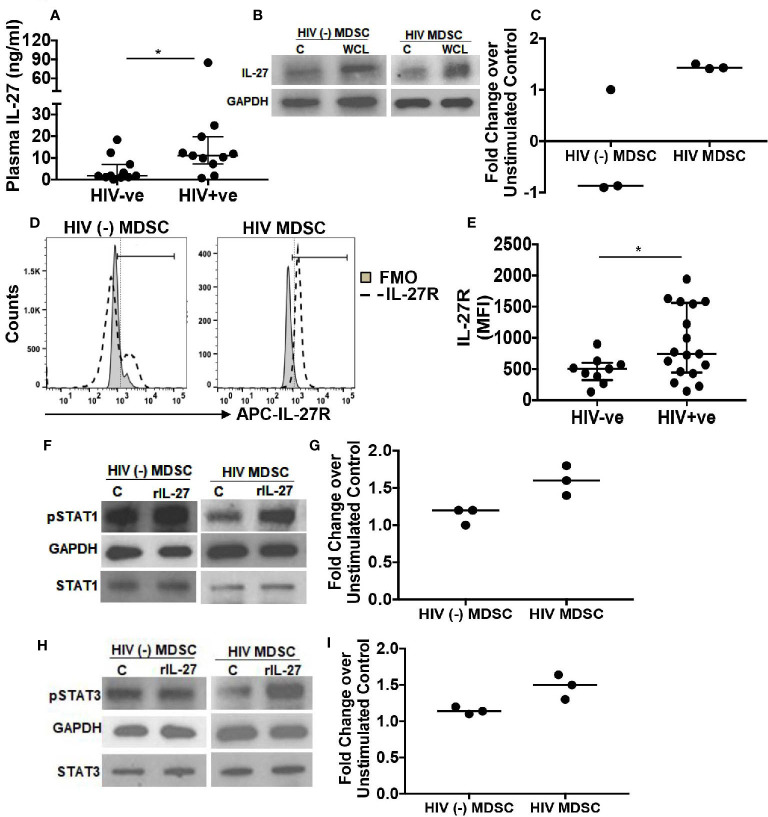
Increased expression of IL-27 and IL-27R by HIV MDSC. To determine the role of IL-27, (A) IL-27 was quantitated in the plasma of HIV (-) and HIV (+) individuals with virologic suppression by ELISA. (B, C) HIV (-) MDSC and HIV MDSC were isolated and cultured without or with M tuberculosis WCL. Total cellular lysates were immunoblotted using anti-GAPDH and –IL-27A antibodies to determine the expression of IL-27p28. Representative Immunoblot of one HIV (-) MDSC and HIV MDSC donor is shown; vertical line is median (B). (D, E) MDSC were isolated and surface stained with anti-IL-27 receptor (IL-27R) antibody. The expression of IL-27R was determined by flow cytometry and Mean Fluorescence Intensity (MFI) calculated. Representative flow cytometry plot is shown (D). (F–I) To determine functional response of IL-27R, MDSC were isolated and stimulated with recombinant IL-27 (rIL-27) for 30-minutes. Total cellular lysates of unstimulated and rIL-27 stimulated cells were immunoblotted using anti-GAPDH, -total STAT1, -total STAT3, -p(Y701)STAT1 and –p(Y705)STAT3 antibody. Fold change was calculated as p -STAT1 or –STAT3 expression in rIL-27 stimulated cells/as p -STAT1 or –STAT3 expression in unstimulated cells. Representative Immunoblot of one HIV (-) MDSC and HIV MDSC donor is shown. For (A, E), each dot representing an individual donor include observations from 25th to 75th percentile; the horizontal line represents the median value; for (C, G, I) each dot represents an individual donor; horizontal line represents the median. *p < 0.05.

