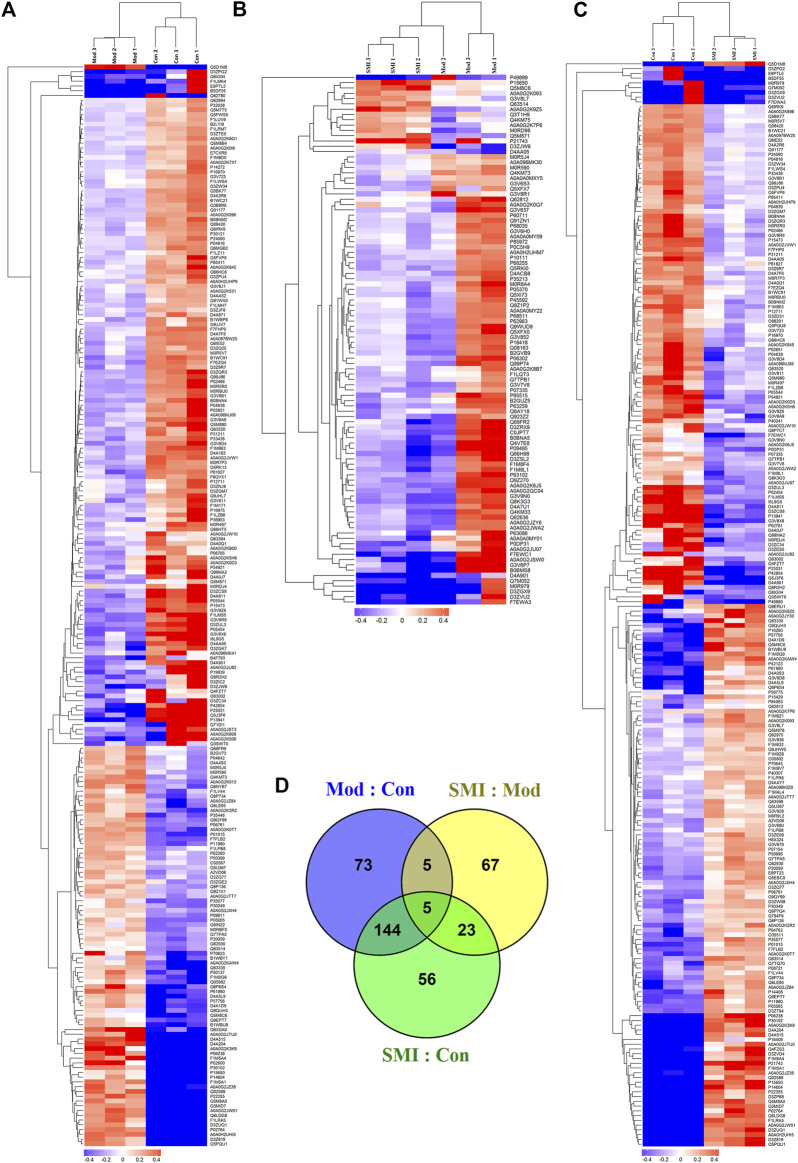
FIGURE 3.
Differentially expressed proteins (DEPs) profiles by TMT-based proteomic analysis. (A, B, C) Heat maps of the overall differential concentrations of proteins quantified in Mod: Con (A), SMI: Mod (B), and SMI: Con (C), respectively. (D) Venn diagram showing overlap of all DEPs among Mod: Con, SMI: Mod, and SMI: Con.

