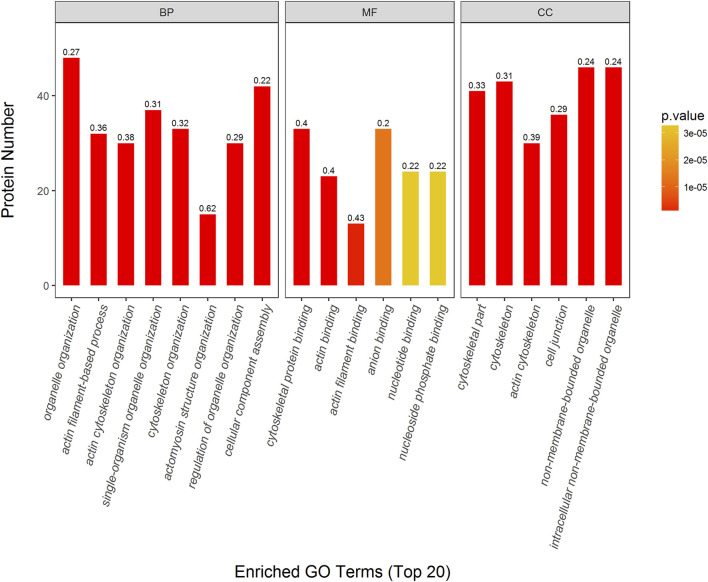
FIGURE 5.
Top 20 enriched GO terms of significantly differentially expressed proteins (DEPs) in SMI: Mod. p value (more lower more intense in red color) represents the enriched degree. Each number above the bar charts is the richFactor (richFactor ≤1), which is the ratio of the number of proteins that have been annotated in this category.

